
October brought some encouraging movement to the Greater Toronto Area housing market. More homes sold than in September, average selling prices increased, and the number of properties available for sale declined.
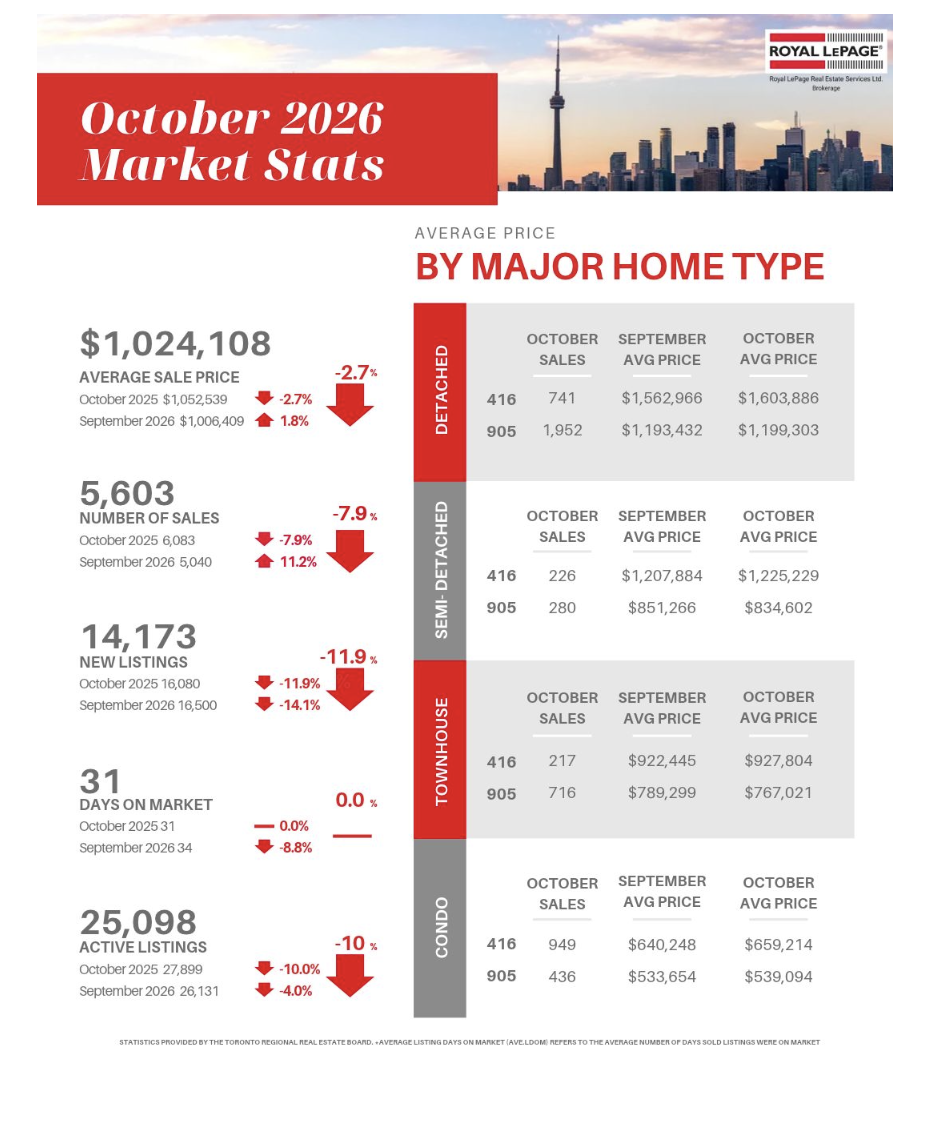
According to the Toronto Regional Real Estate Board (TRREB), 5,603 homes sold across the GTA in October 2026, an 11.2% increase from September. The average selling price reached $1,024,108, up 1.8% month over month.
Compared with October 2025, sales remained 7.9% lower and the average price was down 2.7%. However, the improvement from September was also evident in TRREB's seasonally adjusted figures, which account for typical changes in activity throughout the year.
A Stronger Month for Sales and Prices
October's increase in sales was accompanied by a second consecutive monthly rise in the average selling price, from $993,410 in August to $1,006,409 in September and $1,024,108 in October.
The MLS Home Price Index Composite benchmark, which measures price changes for comparable types of homes, remained 4.3% below October 2025 but also moved higher from September on a seasonally adjusted basis.
Housing affordability has improved considerably compared with 2023 and 2024. TRREB reports that, despite higher borrowing costs than a year ago, lower home prices have helped keep mortgage payments more manageable than during those earlier years.
This matters for households weighing their next purchase. Prices and financing costs need to be considered together, particularly when comparing the cost of moving now with the cost of remaining in an existing home.
Fewer Homes Available for Sale
New listings totalled 14,173 in October, down 11.9% from October 2025.
Active listings — properties still available for purchase at the end of the month — declined to 25,098, approximately 10% fewer than a year earlier and 4% fewer than in September.
Properties spent an average of 31 days on the market, unchanged from October 2025.
There is still meaningful inventory across the GTA, but buyers had fewer available properties to choose from than a year earlier. For sellers, the combination of increased monthly sales and reduced inventory is worth noting when assessing current competition.
How Different Property Types Performed in October
The October results show some important differences between detached homes, semi-detached homes, townhouses and condominiums.
Detached homes recorded 2,693 sales across the GTA, with an average selling price of $1,310,627, up approximately 1.4% from September. Compared with October 2025, the average price was 3.2% lower. Detached properties accounted for nearly half of all GTA home sales during the month.
Semi-detached homes recorded 546 sales, with an average selling price of $1,024,907, approximately 1% higher than September and just 0.8% below October 2025. Semi-detached homes continued to show the smallest annual price adjustment among the four major housing types.
In the City of Toronto, semi-detached properties averaged $1,225,229, an increase of 0.5% compared with October last year.
Townhouses recorded 933 sales at an average selling price of $804,416, down 5% year over year. The average was also approximately 2% below September, making townhouses the exception to the monthly price increases recorded in the other three major property categories.
Condo apartments saw a notable improvement in monthly activity, with 1,385 sales, up 5.2% from September. The average selling price reached $621,400, an increase of approximately 2.7% month over month, although still 5.8% below October 2025.
For buyers looking at condominiums, this is an important distinction. Prices remain lower than a year ago, while October recorded increases in both sales and average prices. Evaluating an individual purchase still requires a close look at the building's financial health, maintenance fees and recent comparable sales.
What the October Numbers Mean for West Toronto and South Etobicoke
One interesting detail in the October report is the difference between the GTA-wide average and the City of Toronto.
While the GTA average selling price was 2.7% lower year over year, the City of Toronto recorded an average of $1,075,627, approximately 0.6% higher than October 2025.
This difference reinforces why regional averages need to be interpreted carefully. Property values vary by location, housing type, condition and the mix of homes that sold during the reporting period.
For homeowners in Bloor West Village, High Park, Swansea, The Kingsway, The Junction, Roncesvalles and South Etobicoke, recent comparable sales remain the most reliable starting point when considering a property's current market value.
For buyers, October's figures show that improved affordability can coexist with increasing monthly sales activity. The practical question is how a particular home compares with other available properties, what similar homes have recently sold for, and whether the total cost of ownership fits their financial plans.
For sellers, pricing needs to account for the competition currently available in their immediate area. A property entering the market in November is competing with today's listings and buyer expectations, regardless of what comparable homes sold for several months earlier.
Looking Ahead to the End of 2026
Through the first ten months of 2026, TRREB recorded 52,694 GTA home sales, compared with 53,680 during the same period last year — a difference of approximately 1.8%.
The year-to-date average selling price was $1,025,156, approximately 4.6% below the corresponding 2025 average.
These figures place October's improvement in context. Sales activity for the year remains relatively close to 2025 levels, while prices have adjusted and the number of new listings has declined.
Employment conditions, inflation and borrowing costs will continue to influence buyer decisions. October nevertheless delivered measurable month-over-month improvements in sales and pricing, providing a useful starting point for evaluating the final months of the year.
Final Word
October's results offer a more encouraging picture of the GTA housing market, with sales increasing, average prices moving higher and available inventory declining.
For buyers and sellers, the next step is understanding how these broader changes relate to the property, neighbourhood and timing involved in their own plans.
Whether you're considering buying, selling, or planning a move in West Toronto or South Etobicoke in 2027, a clear assessment of current property values, financial considerations and timing can help you make a well-informed decision.
Book a Clarity Call to discuss your real estate plans and the options available to you.
Sources: Toronto Regional Real Estate Board, October 2026 Market Watch, released November 4, 2026, and Royal LePage Real Estate Services Ltd., October 2026 Market Stats.