
GTA Market Analysis – January 2026
January is usually the month where everyone asks the same question:
“Is anything actually happening out there?”
The answer this year is: yes—just at a different tempo, with more leverage for buyers and more homework for sellers.
Before we go any further, remember that these are big regional averages. TRREB’s market area covers the GTA and surrounding regions, and it blends detached homes, semis, towns, and condos across dozens of very different neighbourhoods and price points. Some pockets are holding value better, some are softening more, and two houses on the same street can have very different outcomes. These stats are here to give you context for the kind of market we’re in; pricing and strategy still have to be built off specific comparables in your area, not just the averages.
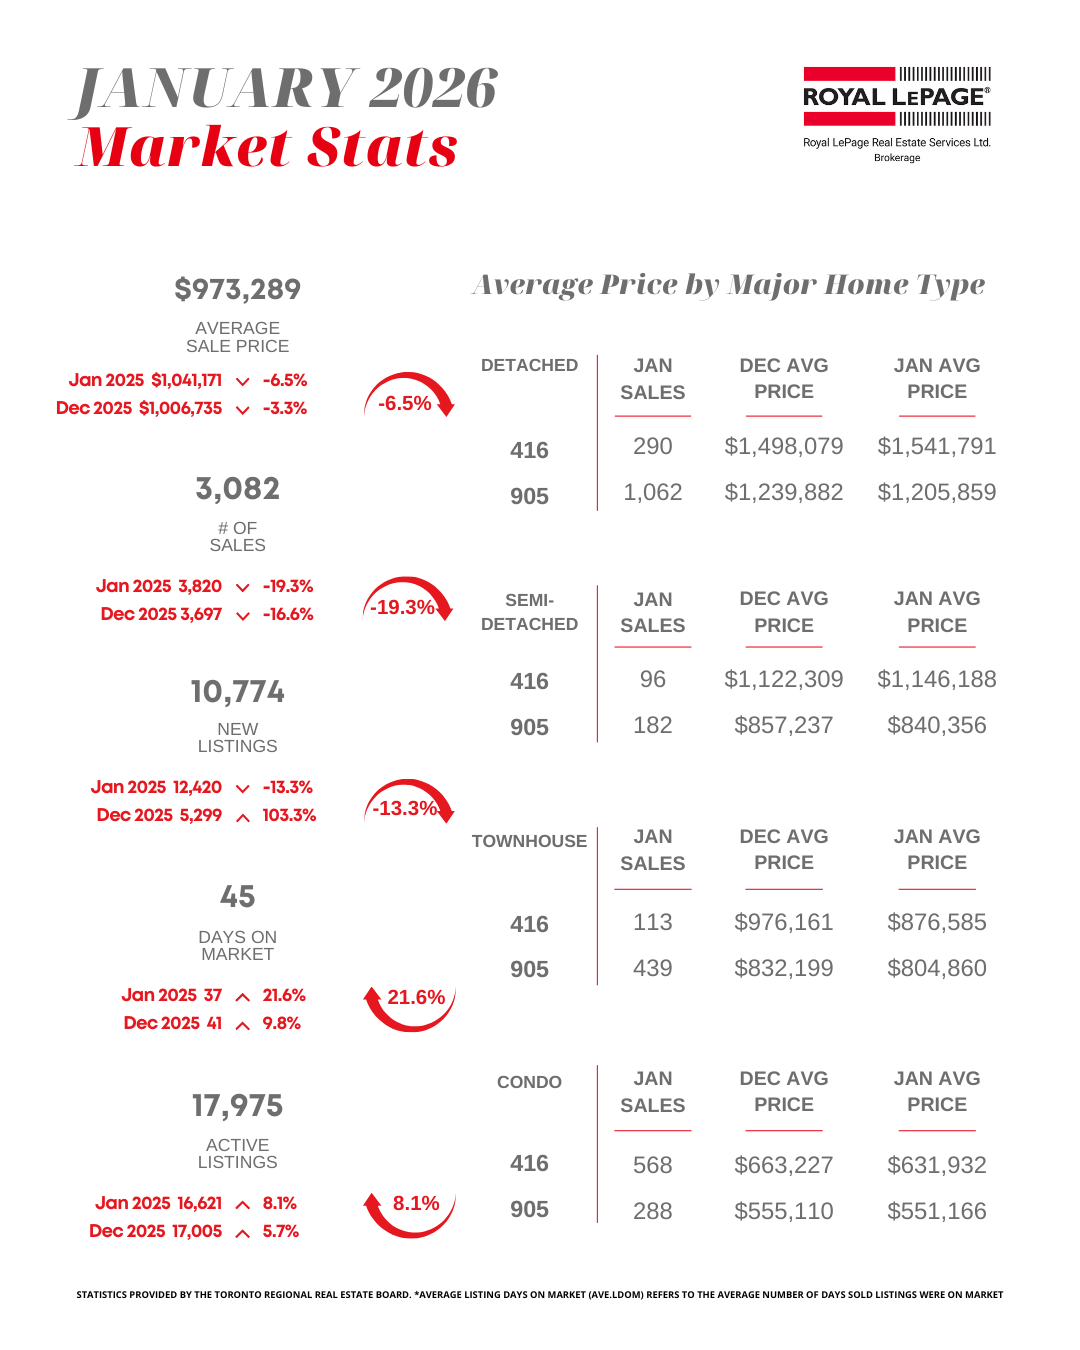
January 2026 at a Glance
The Greater Toronto Area housing market started 2026 with fewer sales, lower prices, and more choice for motivated buyers.
Sales: 3,082 homes sold in January – down 19.3% from January 2025
Average price: $973,289 – 6.5% lower than a year ago and about 3.3% lower than December 2025
New listings: 10,774 – 13.3% fewer than January 2025, but still well above December levels
Active listings: 17,975 – 8.1% higher than a year ago
Average days on market: 45 – up from 37 days last January
The sales-to-new-listings ratio (SNLR) sits around 33%, which means roughly one in three new listings sold in the month. That’s a market where buyers have more leverage and time, and sellers have to be very precise.
The MLS® Home Price Index and the average price both moved lower compared to December 2025. The market is still in a price-discovery phase, adjusting to today’s economics and a Bank of Canada key lending rate of 2.25%.
What These Numbers Actually Mean
January was quieter than last year, but it wasn’t a standstill. 3,082 homes still changed hands across the TRREB market area. Every one of those sales had a buyer and a seller, which means thousands of real decisions were made in a supposedly “slow” month.
The combination we’re seeing now is:
More inventory sitting on the market
Longer days on market
Prices lower than the same time last year
For buyers, that shows up as more choice and better negotiating power.
For sellers, it shows up as more competition and less forgiveness for ambitious pricing or weak preparation.
How Different Property Types Performed in January
Detached
Sales: 1,352
Average price: $1,277,915
Sales volume: down 13.6% year-over-year
Detached homes remain the most active segment by volume, but buyers are sharper. Well-located, well-maintained houses are still moving; tired product or reach pricing is sitting.
Semi-Detached
Sales: 278
Average price: $945,967
Price change: about 9.7% lower than January 2025
Semis have adjusted more on price, which is opening the door for buyers who were priced out of low-rise options a few years ago.
Townhomes
Sales: 552
Average price: $819,543
Sales volume: down 23.7% year-over-year
Townhomes remain the middle ground for many families, but the segment clearly slowed in January. Buyers are weighing townhouses against smaller detached and well-priced semis, and they’re making careful trade-offs.
Condos
Sales: 856
Average price: $604,759
Price change: about 9.8% lower than January 2025
Condos are still a major driver of activity. With more inventory on the market and prices lower than a year ago, first-time buyers and investors have real options—if the building’s financials, maintenance history, and fees check out.
Local Picture: West Toronto and South Etobicoke
In West Toronto — from High Park through Bloor West and The Junction — and across South Etobicoke, January behaved exactly like the stats suggest. Realistic, well-prepared listings still attracted attention and offers. Homes priced for last year, or with obvious issues that weren’t addressed, mostly sat.
Freeholds in the established west-end neighbourhoods and condos and townhomes in the lakeshore pockets saw more negotiation on price, conditions, and timing, as buyers used the extra inventory to be more selective.
Looking Ahead Through 2026
TRREB’s 2026 outlook highlights the role that new construction and the condo sector will play in shaping the next phase of this market. At the same time, we’re already seeing early signs of balance:
Mortgage rates have stabilized
Employment growth in the region is still supportive
Inventory is high enough that serious buyers have time to think, not scramble
This is not the frenzied environment of early 2022, and it’s not a freeze. It’s a negotiated market.
If you’re planning to buy, sell, or reposition a property in the next 12–24 months, the key is to work with the market that actually exists—not the one from three years ago, and not the one the headlines are screaming about.
Final Word
If you’re thinking about selling, buying, or repositioning a property in 2026, this is the time to get your numbers straight and your plan clear. Nothing has to happen overnight, but this is a good moment to look beyond the next few months and map out the next few years.
If you want to see how these January numbers translate to your street, your condo building, or your next move, please book a Clarity Call 📞
Whether you're buying, selling, or simply tracking the market—I’m here to help you navigate it with clarity, strategy, and grounded advice.
Luba Beley, BROKER
Real Estate With Integrity
📩 Let’s connect.
📞 416-419-5226
📍 Serving Toronto, Etobicoke, and the GTA West