Viewing entries tagged
housing market toronto

Adjusting Expectations - 2017 GTA Housing Market in Review

Comment

Adjusting Expectations - 2017 GTA Housing Market in Review

The Toronto Real Estate Board (TREB) announced that Greater Toronto Area (GTA) REALTORS® reported 92,394 sales through TREB’s MLS® System in 2017.  This total was down 18.3% compared to the record sales reported in 2016.

But let’s put the 2017 sales into an historical perspective.  Even if we include the record sales of 101,213 in 2015 and 113,040 in 2016 in the equation, the GTA recorded 95,916 sales per year on average over the five year period from 2012 to 2016.  Taking that into consideration, 2017’s results are only off by 3.7% from the 5-year average.  In addition, there has been only one other year (besides 2015 and 2016) when sales breached the 93,000 mark, and that was in 2007, before the “Great Recession”, when the GTA recorded 93,193 sales.

After record sales in all segments of the market in Q1, the pace of sales decline in Q2 and Q3 after the Ontario Fair Housing Plan (i.e. the foreign buyers tax) was introduced. Q4 brought back some strength to the market as some buyers arguably brought forward their home purchase to beat the introduction in January of 2018 of the changes to the federal mortgage lending guidelines (the “stress test”).

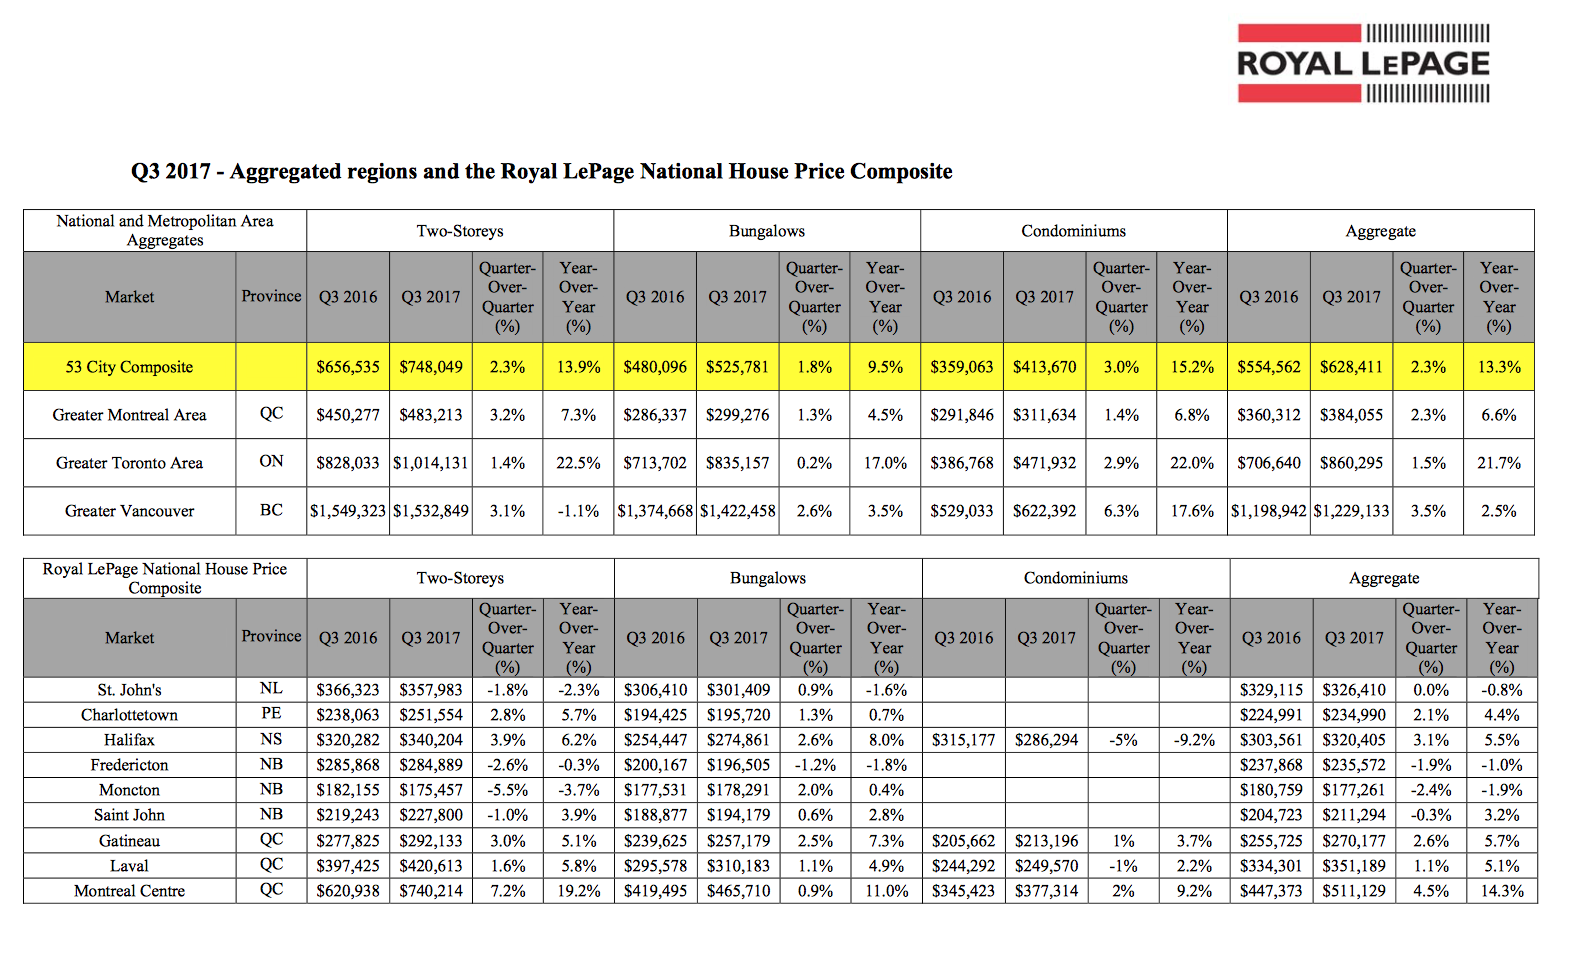
Despite the drop of 20,646 annual sales from the 2016 figure, the average sales price recorded in the GTA for 2017 as a whole rose by 12.7% to $822,681, from $729,837 in 2016, although home price growth in the second half of 2017 differed substantially depending on market segment.  The drop was felt primarily in the most expensive detached market segment, where sales dropped by 12,381 homes or 23.0%, but representing almost 60% of the total unit sales decrease of 20,646 units.  The average price of a single detached home in the GTA increased in 2017 by 12.7% to $1,098,951, forcing many buyers to look for less expensive options.  At the other end of the market spectrum, condominium apartments experienced a drop of 2,853 unit sales, or 9.6%, accounting for approximately 13.8% of the total decrease of 20,646 units, but prices in this segment were up 23.1% from 2016 levels to an average of $512,478 in 2017.

These factors also contributed to the shift in relative share of total sales where the percentage of single detached homes decreased by 2.8% to 44.7% of units sold and the share of condominium apartments rose by 2.8% to 29.1% of total units sold.  Expectations are that as more millennials begin to reach the age of home ownership, the trade-off between housing type and location will likely become more prevalent in the future across the GTA and this will also place a significant strain on inventory, turning the process of finding a home into an exercise in adjusting expectations.

According to Royal LePage’s most recent Market Survey Forecast, the company predicts that the aggregate price of a home in the GTA will appreciate by 6.8% by the end of 2018, as many purchasers become acclimatized to the new mortgage rules and continue to compete over low inventory levels, particularly in the condominium market where demand significantly exceeds supply due to the long lead times in building these units. 

If you are curious to know how much your property is worth today or how much you can afford to buy, please feel free to reach out; and if you found this article helpful please hit "Like" and "Share".


Comment

Signals of a Healthy GTA Real Estate Market Continue

Comment

Signals of a Healthy GTA Real Estate Market Continue

There were a total of 7,118 residential sales reported through TREB’s MLS system in October, compared to 9,715 transactions a year ago.  Even though the number of transactions was down by 26.7% year-over-year, the jump of almost 12% in residential sales reported between the months of September and October in 2017 was more pronounced than usual compared to the last 10 years, a clear signal that market momentum is picking up.

Active listings were 78.5% higher than a year ago, an indication that supply and demand are continuing to balance out as inventories settled at 2.6 months of supply in October, down marginally from the 3.0 months of supply in September, but still much healthier than the scant 1.1 months of supply experienced in October, 2016.  There is, however, a continuing lack of quality listings in core GTA neighbourhoods and there are early indications that offer dates are reappearing as homes are being underpriced to generate bidding wars, although this has yet to manifest in the overall selling price to list price ratio which is currently holding at 98%.

While the average selling price for October transactions was $780,104 – up by 2.3% compared to the average of $762,691 in October 2016 -  the continuing low supply of, and high demand for, condominiums fuelled a 21.8% increase in prices in that segment of the market.

Expectations are that market activity will pick up further in the next 6-8 weeks as buyers rush to obtain mortgage pre-approvals and submit offers before the new stress tests announced by OSFI last month are implemented at the beginning of 2018, further reducing buying power as the pre-qualification hurdle rate increases to the higher of the 5-year benchmark rate published by the Bank of Canada or your negotiated contract borrowing rate + 2%.

Do you remember the story of Goldilocks and the Three Bears?  When Goldilocks arrived at the bears’ house in the forest there were three bowls of porridge on the table and she was hungry. The first bowl of porridge she tried was “too hot”, the next one was “too cold”, but the third one was “just right”.  Well, this just might be a “Goldilocks” moment in the GTA housing market!

If you are curious to know how much your property is worth today or how much you can afford to buy, please feel free to reach out; and if you found this article helpful please hit "Like" and "Share".


Comment

Renting or Buying? New Regulations Are Making Affordability More Difficult

Comment

Renting or Buying? New Regulations Are Making Affordability More Difficult

Beginning January 1, 2018, if you are buying a home, even if you have equity of 20% or more, a new regulation announced this week by OSFI (the Ontario Superintendent of Financial Institutions) could make it more difficult for you to qualify for a mortgage.

The revised Residential Mortgage Underwriting Practices and Procedures include several key changes that the regulator says is part of its expectation that federally-regulated mortgage lenders remain vigilant in their underwriting practices, the most significant of which is a new “stress test”.

One fear hitting the headlines today is that the impacted borrowers will turn to unregulated lenders including credit unions and caisses populaires, which are not subject to the new rules.

 If you stay with the same institution, banking competition will be even further restricted as those renewing mortgages will not have the ability to shop around. Great for the banks!

In order to qualify for an uninsured mortgage the minimum qualifying rate for uninsured mortgages will be the greater of the five-year benchmark rate published by the Bank of Canada or the contractual mortgage rate +2%.  So if the Bank of Canada five-year rate is 5% and you are able to negotiate a lower rate from your financial institution – say 3.5%, then the stress test will mean that you would otherwise have to qualify for a 5.5% rate mortgage in order to be approved.  Alternatively, if you were only able to negotiate a 50 basis point reduction from the posted rate, or 4.5%, then you would have to show that you would qualify for a 6.5% rate mortgage of the same amount.  What this will likely mean for most borrowers, is that they will not be able to afford the home that they thought they could before the change in regulations.

For example, as reported by TREB (The Toronto Real Estate Board) the average price of a semi-detached home in the GTA in September, 2017 was $752,379.  A buyer with a 20% down payment would need a mortgage of approximately $600,000 in order to purchase this “average” home.  Let’s say that the Bank of Canada five-year benchmark rate is 5.0% and that this purchaser was able to negotiate a rate of 4% with their financial institution.  Therefore, the purchaser would have to demonstrate that they could afford the payments on a 6% mortgage of this amount (roughly an additional $350.00 per month or $4,200.00 per year on a monthly pay mortgage amortized over 25 years), otherwise they would only qualify for a smaller mortgage.  If they could not come up with that extra income to show that they would qualify for a $600,000 mortgage under the new regulation, then they would have to settle for a mortgage of $545,000, meaning that with their $150,000 down payment they could only afford a home priced around $695,000, or roughly 8% less than the price of the average semi-detached home selling currently in the GTA.

So for many, the alternative will be to look for a smaller home to purchase, perhaps a less expensive condominium, rent or move out of the city.  And sadly, the news does not get much better with those alternatives, due to the shortages of available units in both the sales and rental markets for condominiums.  And affordability is becoming a real issue as the focus of buyers and renters alike has shifted to condominiums, bidding up prices both for units for sale and units for rent.

Urbanation just released its analysis of this year’s third quarter and found condo rents averaged $2,219 a month for units averaging 743 square feet – a $232 year-over-year increase. It also found that newly signed leases in the third quarter, at 7,761, hadn’t much changed in a year.

A new report commissioned by the Federation of Rental-Housing Providers of Ontario says the Liberal government’s Fair Housing Plan has negatively impacted the province’s rental housing supply. Before the introduction of the government legislation, 28,000 rental units were in the planning pipeline, but since the new rules were introduced 1,000 of those units have been cancelled or converted to condominiums. The report estimates that if 6,250 new rental units are not built per year in Ontario supply will continue to drop and naturally drive the demand up and the prices.

A lot of factors have conspired to put relentless pressure on the rental market – the astronomical cost of homeownership, stricter mortgage qualifications, high migration and the Fair Housing Plan, among others – but none has been more pronounced than the supply shortage.  Moreover, the reintroduction of rent control has provided tenants increased incentive to remain in their dwellings, stunting the turnover rate.

Tim Hudak, CEO of OREA (The Ontario Real Estate Association) recently had this to say about the latest regulation. “It’s time for governments to hit the brakes on more demand side policy interventions and take a wait and see approach. Ontario’s housing market is too important to the provincial economy to move ahead with unnecessary regulation that will hurt the dream of home ownership.”

If you are curious to know how much your property is worth today or how much you can afford to buy, please feel free to reach out; and if you found this article helpful please hit "Like" and "Share".

Comment

Expanding Regional Economies to Lift Home Prices in Canada’s Major Markets

Comment

Expanding Regional Economies to Lift Home Prices in Canada’s Major Markets

Shorter than anticipated housing market correction puts Toronto back on track 

Highlights:

  • Toronto to have a shorter housing correction than seen in Vancouver

  • Tighter access to mortgage financing and eroding affordability in Vancouver and Toronto have more buyers shifting their focus to condominiums, putting upward pressure on price appreciation

  • Rising interest rates and a strong Canadian dollar support more moderate home price appreciation

TORONTO, October 12, 2017 – According to the Royal LePage House Price Survey [1], home prices in Canada’s five most populated housing markets are rising at a similar, healthy pace on a quarter-over-quarter basis, the first time this has occurred in six years.

The year-over-year price change data in the Royal LePage House Price Composite is the most useful metric for determining the health of Canada’s real estate market. However, examining quarter-over-quarter movements can reveal useful short-term housing market trends. In the third quarter, home prices in the Greater Toronto Area, Greater Vancouver, Greater Montreal Area, Calgary and Ottawa all rose at rates between 1.5 and 3.5 per cent on a quarter-over-quarter basis, indicative of a much more balanced Canadian residential real estate market.

The Royal LePage National House Price Composite, compiled from proprietary property data in 53 of the nation’s largest real estate markets, showed that the price of a home in Canada increased 13.3 per cent year-over-year to $628,411 in the third quarter. When broken out by housing type, the median price of a standard two-storey home rose 13.9 per cent year-over-year to $748,049, and the median price of a bungalow grew 9.5 per cent to $525,781. During the same period, the median price of a condominium rose 15.2 per cent to $413,670.

“Uneven regional economic growth has plagued Canada for much of the past decade, a challenge most evident in the nation’s housing markets,” said Phil Soper, President and CEO, Royal LePage. “For the first time since 2011, we are seeing real estate in all five of our largest cities appreciate at a manageable, healthy clip. Canadian housing is enjoying a Goldilocks moment – not too hot, and not too cold.”

“For now, the Toronto and Vancouver housing markets have returned to earth,” continued Soper. “After a period of unsustainable price inflation and sharp market corrections, we are seeing low single digit appreciation in each. Calgary has shaken off the oil-bust blues and Montreal appears to be at the beginning of a new era of economic prosperity. Rounding out the ‘big five,’ the Ottawa market is behaving like it usually does – a picture of healthy market growth.”

“Marginally higher borrowing costs should dampen domestic demand somewhat, and with less currency-adjusted purchasing power, foreign buyer activity is off peak levels and will likely stay that way in the near-term,” added Soper.

During the third quarter, the Greater Toronto Area saw the largest year-over-year home price increase of any major Canadian market, surging 21.7 per cent on the back of strong gains witnessed at the beginning of 2017. Meanwhile, home prices in Montreal continued to climb at a rate beyond what has been the historical norm, appreciating by 14.3 per cent when compared to the same time last year, while Ottawa grew by 7.9 per cent over the same period. When looking at the largest markets in Canada’s westernmost provinces, Calgary and Greater Vancouver inched further out of their recovery, with home prices rising 5.0 and 2.5 per cent year-over-year, respectively.

Following a very similar trend to the Vancouver housing correction of 2016, the Greater Toronto Area market experienced a sharp drop in sales volumes beginning in April 2017, which continued through much of the third quarter. With underlying employment and economic growth on solid footing, the Toronto market began to grow again in August.

Potential buyers who were previously on the sidelines taking a wait-and-see approach have now jumped back into the market after realizing prices did not drop as certain market watchers had anticipated. On the supply side, some sellers who had attempted to capitalize on an uncharacteristically strong spring have taken their homes off the market. Together, these trends have caused the region to revert to a more balanced market where supply and demand have stabilized in the majority of areas.

Nationally, condominium prices increased 15.2 per cent on a year-over-year basis and have begun to appreciate faster than any other housing segment in large urban centres such as Toronto and Vancouver. This is likely to continue for the foreseeable future and begin a trend in other cities. The overall affordability of condominiums continues to attract first-time homebuyers and purchasers looking for attractively-priced real estate as new mortgage regulations, interest rate increases and higher home prices have effectively limited purchasing power.

Under the Ontario Fair Housing Plan, all private rental units in the province are now subject to rent control, and housing market watchers have a number of concerns regarding the impact of this legislation. Removing the ability to adjust prices by more than 2.5 per cent a year when long-term residential real estate price appreciation is approximately 5.0 per cent per year makes rental units less attractive to investors. It is likely fewer purpose-built rental projects will be launched in the near future. According to one industry report, more than 1,000 such projects have already been cancelled and vacancies have already fallen to 1.3 per cent across the GTA[2].

“Ontarians deciding between renting and buying a home are facing two tough options,” said Soper. “Purchasers trying to break into the entry-level market now face a highly competitive environment, while those waiting to buy are met with high rental prices brought on by a significant shortage of inventory.”

“There may be unintended consequences to new province-wide rent controls,” concluded Soper. “We need more family-sized units in the province’s cities; apartments with two or three bedrooms. Yet purpose-built rental projects are likely to focus on smaller bachelor or one-bedroom units, which tend to attract shorter-term tenants. The higher turn-over allows landlords to raise rates more frequently. This will put further upward pressure on the price of existing family-sized rental units.”

Full article link here.

Provincial and City Summaries and Trends

Screen Shot 2017-10-16 at 11.25.31 AM.png
Screen Shot 2017-10-16 at 5.16.53 PM.png
Screen Shot 2017-10-16 at 5.17.14 PM.png

For more information visit: www.royallepage.ca

[1] Aggregate prices are calculated using a weighted average of the median values of all housing types collected. Data is provided by RPS Real Property Solutions.

[2] Urbanation Inc. report prepared for the Federation of Rental-housing Providers of Ontario, “Ontario Rental Market Study: Measuring the Supply Gap,” September 2017

If you are curious to know how much your property is worth today, please feel free to reach out, and if you found this article helpful please hit "Like" and "Share".


Comment

More Inventory Starting to Attract More Buyers

Comment

More Inventory Starting to Attract More Buyers

IT LOOKS LIKE THE WORST IS OVER FOR THE TORONTO HOUSING CORRECTION

Last month I spoke about how the Greater Toronto Area Real Estate Market is beginning to change shape and return to balance. Well, the evidence is in, as the number of new listings entered into The Toronto Real Estate Board’s MLS® System amounted to 16,469 in September – up by 9.4 per cent year-over-year.  But the real story is that total active listings stood at 19,021, a whopping 69% increase year-over-year.  TREB suggests that the improvement in listings in September compared to a year earlier is a sign that home owners are anticipating an uptick in sales activity as we move through the fall, or put another way, more inventory is starting to attract more buyers back to the market.

TREB announced that Greater Toronto Area REALTORS® reported 6,379 sales through TREB’s MLS® System in September, roughly the same amount as in August, but 35 per cent lower than September of last year.  In a balanced market, buyers take longer to make up their minds, as there is more product available to choose from.  Likewise, sellers need time to get adjusted to the new market reality.  Remember, the last few years were anything but “ordinary”.

Think of it this way.  Last year at this time, inventory (the number of active listings on MLS®) stood at approximately one month of sales.  So, on average, every home on the market was selling within a month or less, with multiple offers driving up the price paid due to the scarcity of supply.  Now that inventory is closer to 3 months supply, what this means is that 1 out of every 3 houses on average is selling within the month, and price is no longer being dictated by the frenzy we saw when homes were in such short supply.  So it makes sense to see that sales are about a third lower in September 2017 than they were in September of last year.  All of this is happening against a backdrop where average prices are still increasing, albeit at a lower rate than we saw during the run up.  The average selling price of a home in the GTA in September 2017 was $775,546 – up 2.6 per cent compared to September 2016.

However, the exception continues to be the condominium apartment market segment, where average prices were up on average by 23 per cent compared to last year. TREB reported in September that “tighter market conditions for condominium apartments follows consumer polling results from the spring that pointed toward a shift to condos in terms of buyer intentions”. In fact, condos accounted for almost 30 per cent of all MLS home sales across the GTA during the month of September, whereas detached homes – the most expensive market segment on average - accounted for a smaller share of overall transactions this year compared to last.

If you are curious to know how much your property is worth today, please feel free to reach out and if you found this article helpful please hit "Like" and "Share".


Comment