Viewing entries tagged
bloor west

Annual Price Growth Stronger in Higher Density Home Types

Comment

Annual Price Growth Stronger in Higher Density Home Types

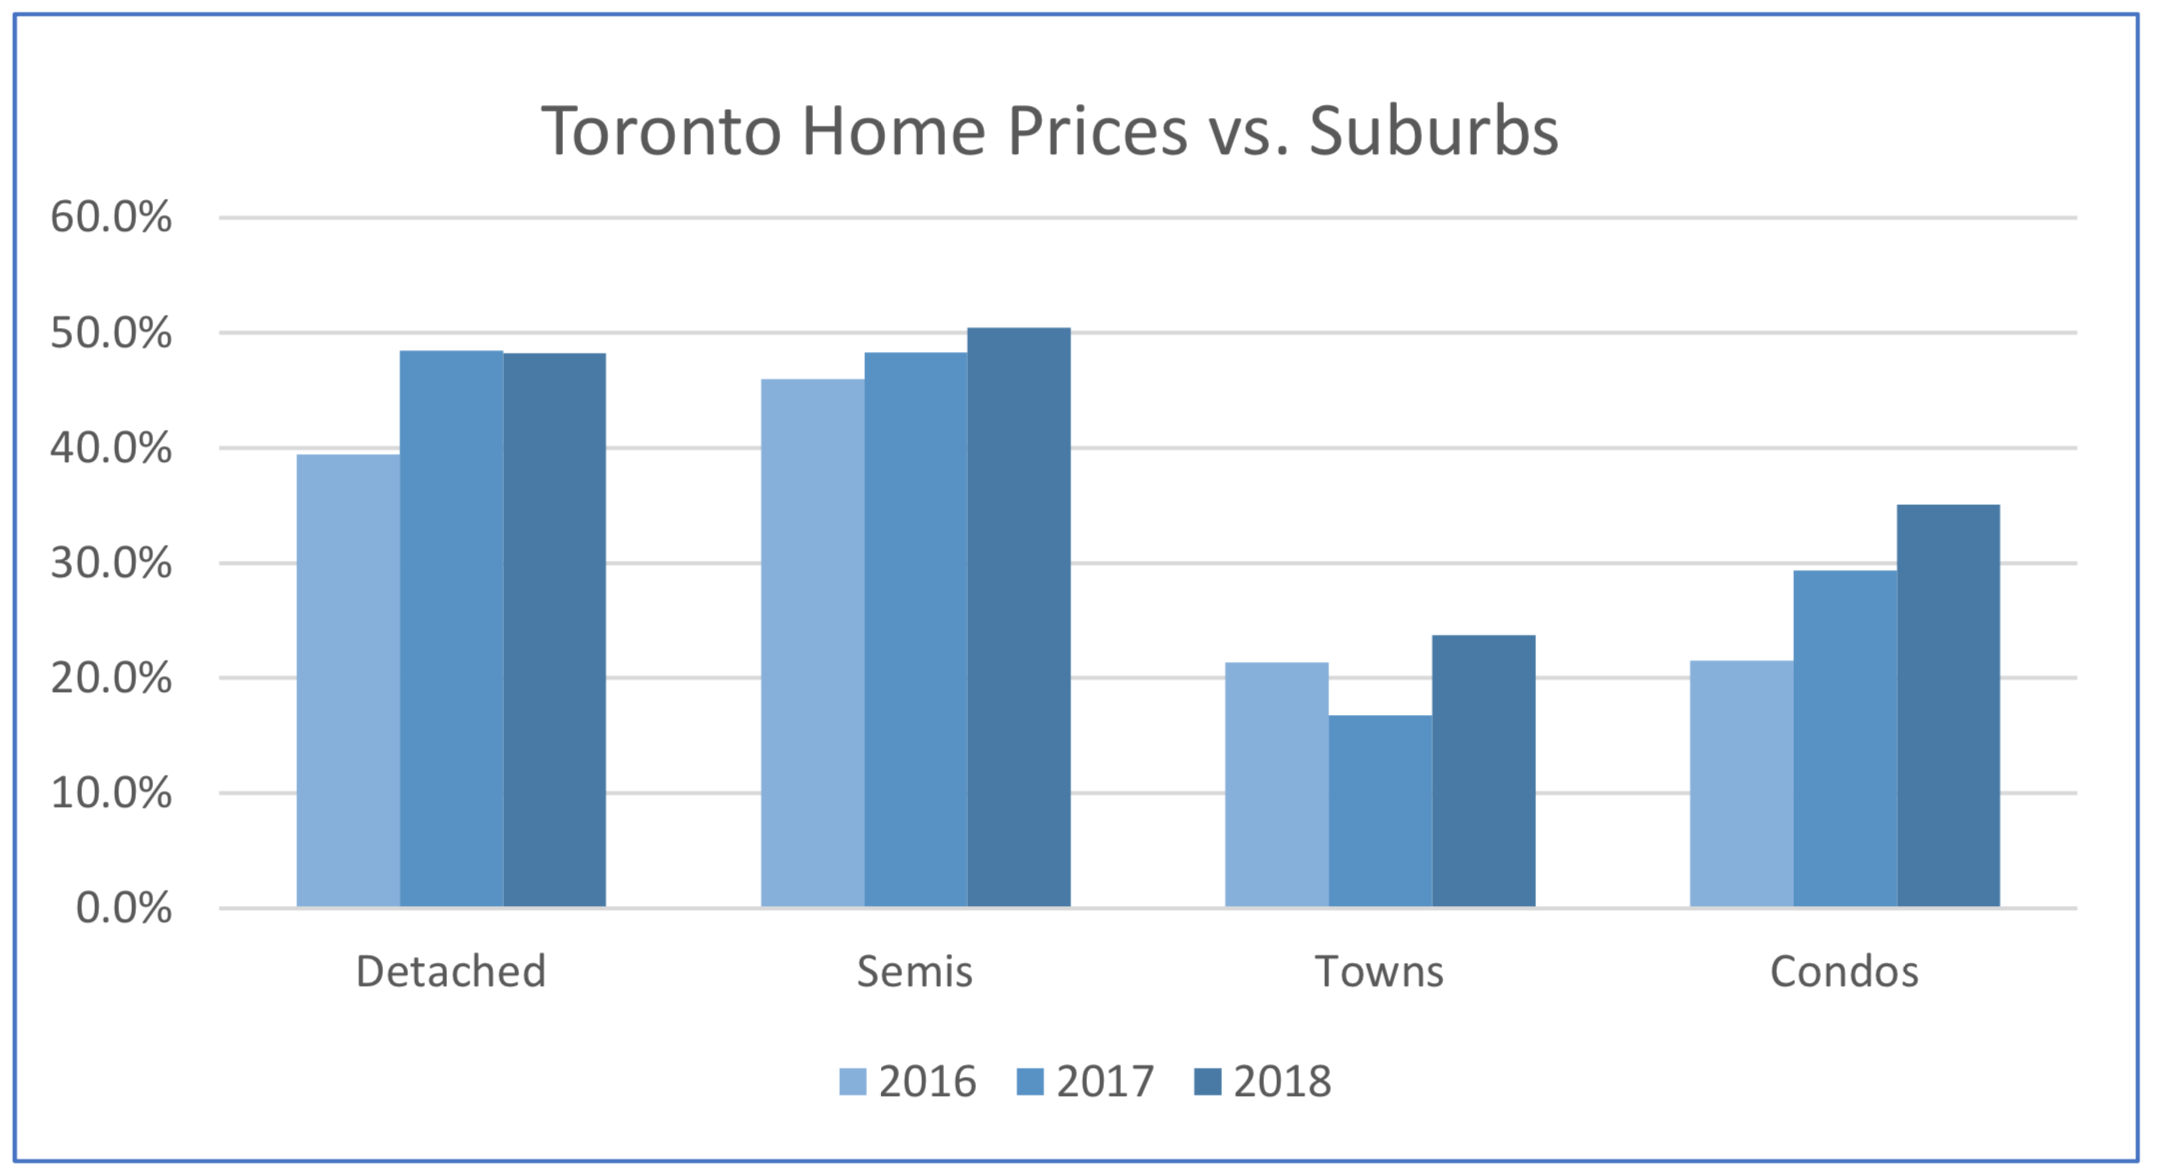
The rate of increase in Toronto home prices continues to outpace that of the 905 regions, particularly in the higher density home types.  The price of a detached home in Toronto was roughly 50% higher than in the suburbs on average in September.  Two years ago the price of a detached home in the City was approximately 40% higher than one in the suburbs.  Compare that with condo prices in the City, which two years ago were about 20% more expensive than in the suburbs, but in September, 2018 are now almost 35% more expensive, as seen in the chart below.  The average price of the 6,455 homes sold in the GTA in September was $796,786, 2.9% higher than the average of $774,489 a year earlier when 6,334 units were sold in the GTA.

Screen Shot 2018-10-05 at 8.59.42 AM.png

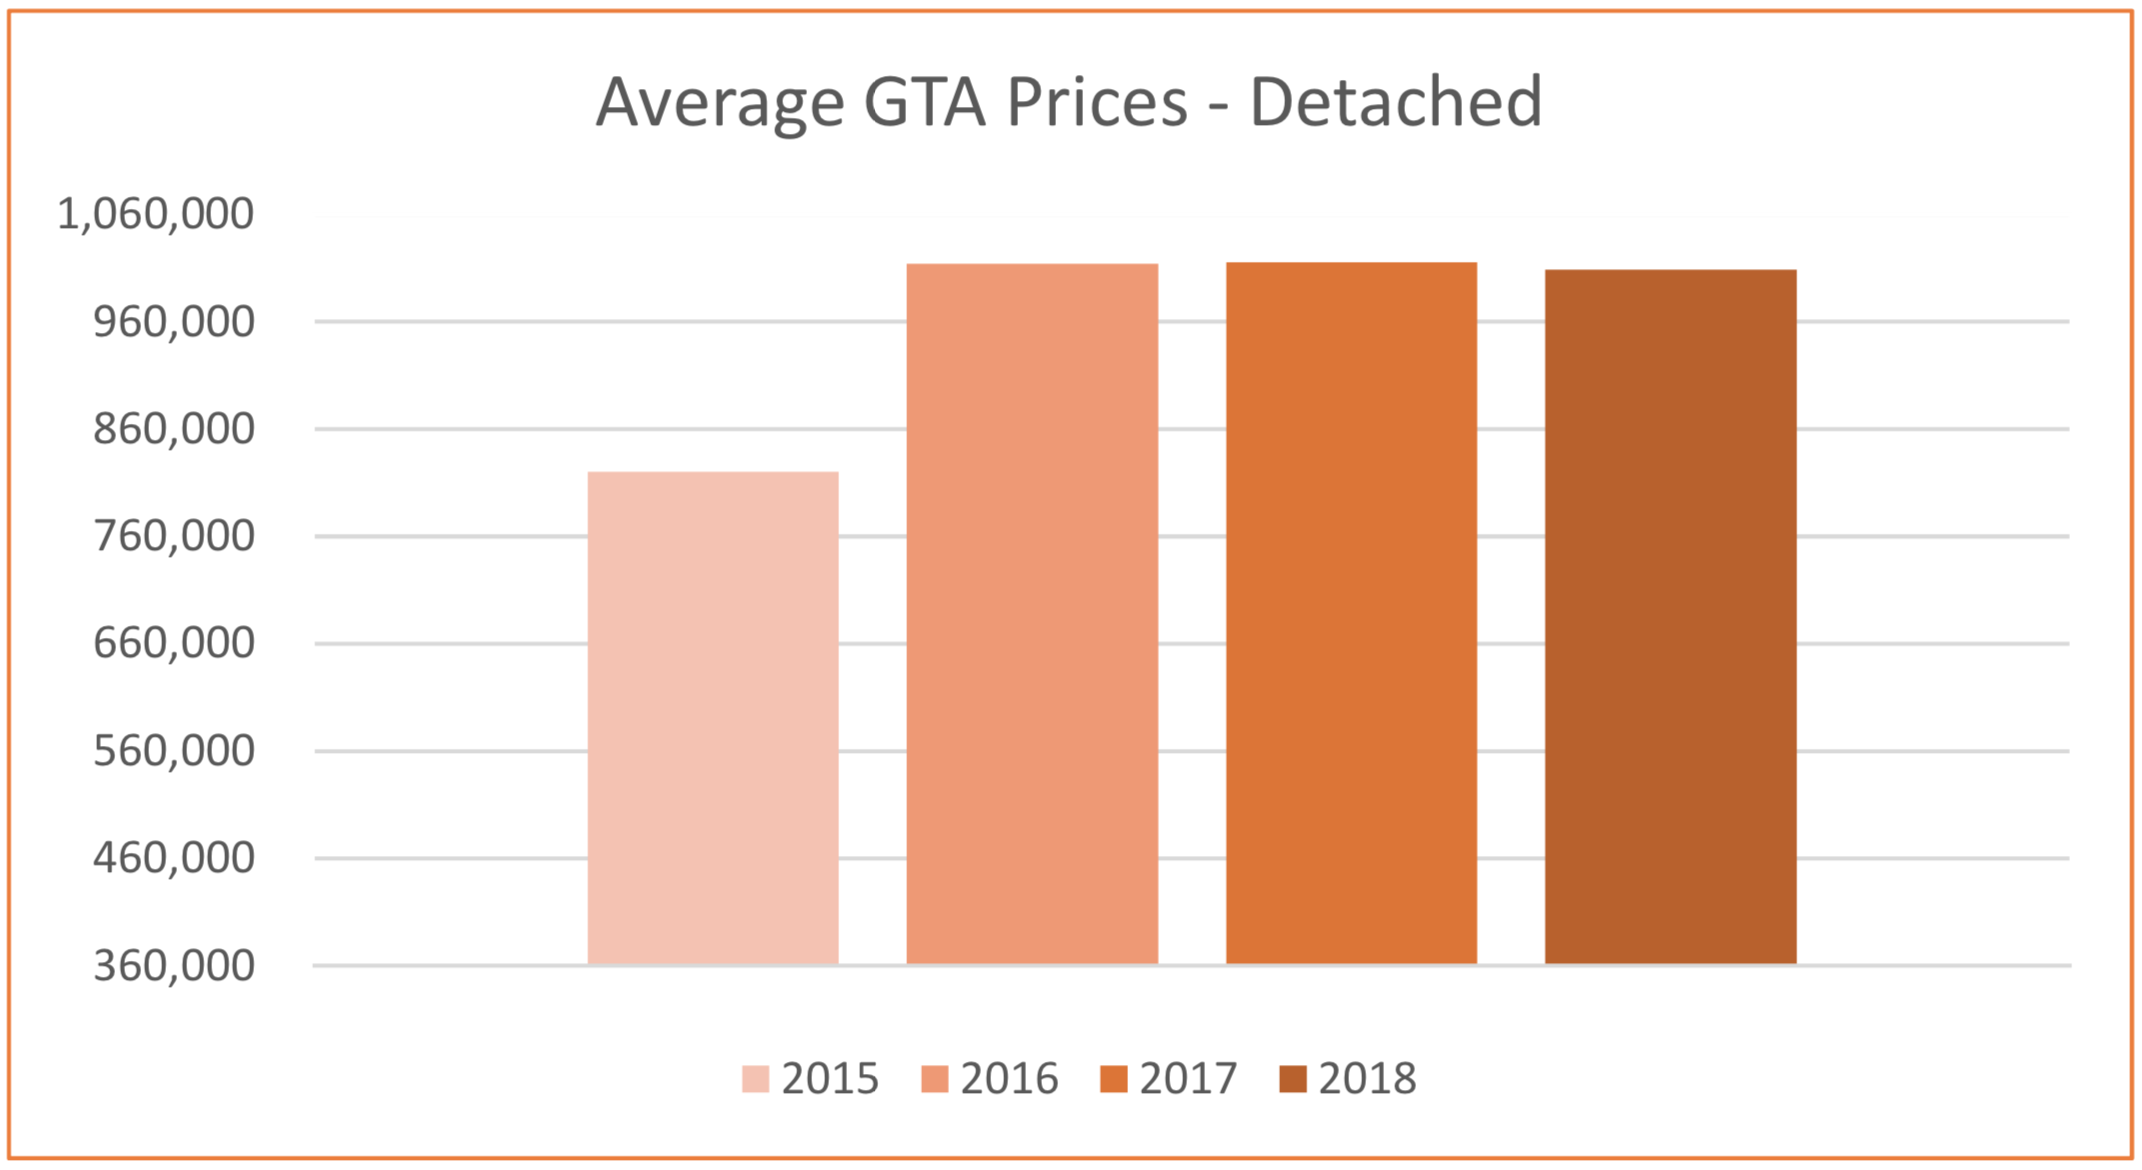
The more affordable home types including condominiums, townhouses and semi-detached homes all saw strong price growth in September, compared to the prior year.  In contrast, the average price of a detached home in the GTA was relatively flat compared to 2017.  The average price of a detached home in the City of Toronto, where approximately 23% of total GTA detached home sales occurred, was down by 1.4%, compared to the suburbs, where the average price was 0.6% less than a year earlier.  The average selling price for a detached home in Toronto in September was $1,342,363, compared to the average suburban selling price of $905,722.

Screen Shot 2018-10-05 at 9.02.30 AM.png

In the City of Toronto, where slightly more than 70% of total GTA condominium sales occurred in September, the Toronto Real Estate Board (TREB) reported 1,282 condominium unit sales. The average price of a condominium in Toronto rose by 11.7% in September year-over-year, almost twice the rate of increase in the price of the average condominium in the 905 regions, where prices rose by 6.4%. The average selling price for condominium in Toronto in September was $615,582, compared to the average suburban selling price of $455,686.

Screen Shot 2018-10-05 at 9.03.52 AM.png

This final chart shows how Toronto has continued to dominate the share of the total GTA condominium sales in September for the past three years.  Now more millennials and Gen Z (those born between the early 1980s and early 2000s) are entering the housing market.  For them, a condo lifestyle is both preferred and affordable.  Condos also remain in high demand among retiring boomers, particularly those who are downsizing and wish to remain in an urban setting in a large metropolitan City such as Toronto.

Screen Shot 2018-10-05 at 9.05.05 AM.png

If you would like to find out what these statistics mean to you, or if you are curious to know how much your property is worth today or how much you can afford to buy, please reach out. 

If you found this article helpful please hit "Like" and "Share".


Comment

More Signs that Toronto Area Real Estate Market is in Recovery Mode

2 Comments

More Signs that Toronto Area Real Estate Market is in Recovery Mode

Year-over-year resale home prices and sales rose for a second consecutive month in July, signalling that the Toronto area real estate market is in recovery mode.

Average selling prices climbed 4.8% to $782,129 last month, up from $745,971 in the same period last year and the number of homes sold rose 18.6% to 6,961 units, compared to 5,869 homes sold in July, 2017.

Condominiums continued to outperform low rise housing such as detached, semi-detached and townhomes.  On average last month condo prices rose 8.9% across the GTA to $546,984.  What is interesting to note, however, is that even though roughly 70% of the condos sold last month were in the City of Toronto (416), the rate of price appreciation has been shifting in favor of the suburban markets (905), where prices were up by 10.3%  in July, compared to 9.2% for the City of Toronto.  This is a dramatic shift from the month of June, when condominium prices in Toronto rose by more than 9% while the suburban markets only posted price appreciation of less than 4%. A condominium in Toronto cost $582,547 on average, compared to $461,255 in the surrounding regions.

Screen Shot 2018-08-06 at 1.38.55 PM.png

Year-over-year prices for detached homes, rose by 0.5% on average in July to $1,004,647, but the scarcity of detached homes listed for sale in Toronto helped boost prices by 3.6% inside the City, while prices remained flat in the surrounding 905 communities where roughly 3/4 of all the detached home sales were recorded.  A detached house in Toronto cost $1,350,700 on average, compared to $907,347 in the surrounding regions.

Screen Shot 2018-08-06 at 1.39.09 PM.png

Months of inventory across all home types in the GTA stood at roughly 2.8 months supply in July compared to 2.4 months supply a year earlier, but the numbers look very different when viewed by housing type and location.  As seen in the chart below, months of inventory of detached homes are roughly double that of any other housing type, and this is even more pronounced when one compares Toronto to the surrounding regions where inventories across all housing types are generally about one month higher than in the City.

Screen Shot 2018-08-06 at 1.39.09 PM.png

If you would like to find out what these statistics mean to you, or if you are curious to know how much your property is worth today or how much you can afford to buy, please reach out. 

If you found this article helpful please hit "Like" and "Share".

2 Comments

Adjusting Expectations - 2017 GTA Housing Market in Review

Comment

Adjusting Expectations - 2017 GTA Housing Market in Review

The Toronto Real Estate Board (TREB) announced that Greater Toronto Area (GTA) REALTORS® reported 92,394 sales through TREB’s MLS® System in 2017.  This total was down 18.3% compared to the record sales reported in 2016.

But let’s put the 2017 sales into an historical perspective.  Even if we include the record sales of 101,213 in 2015 and 113,040 in 2016 in the equation, the GTA recorded 95,916 sales per year on average over the five year period from 2012 to 2016.  Taking that into consideration, 2017’s results are only off by 3.7% from the 5-year average.  In addition, there has been only one other year (besides 2015 and 2016) when sales breached the 93,000 mark, and that was in 2007, before the “Great Recession”, when the GTA recorded 93,193 sales.

After record sales in all segments of the market in Q1, the pace of sales decline in Q2 and Q3 after the Ontario Fair Housing Plan (i.e. the foreign buyers tax) was introduced. Q4 brought back some strength to the market as some buyers arguably brought forward their home purchase to beat the introduction in January of 2018 of the changes to the federal mortgage lending guidelines (the “stress test”).

Despite the drop of 20,646 annual sales from the 2016 figure, the average sales price recorded in the GTA for 2017 as a whole rose by 12.7% to $822,681, from $729,837 in 2016, although home price growth in the second half of 2017 differed substantially depending on market segment.  The drop was felt primarily in the most expensive detached market segment, where sales dropped by 12,381 homes or 23.0%, but representing almost 60% of the total unit sales decrease of 20,646 units.  The average price of a single detached home in the GTA increased in 2017 by 12.7% to $1,098,951, forcing many buyers to look for less expensive options.  At the other end of the market spectrum, condominium apartments experienced a drop of 2,853 unit sales, or 9.6%, accounting for approximately 13.8% of the total decrease of 20,646 units, but prices in this segment were up 23.1% from 2016 levels to an average of $512,478 in 2017.

These factors also contributed to the shift in relative share of total sales where the percentage of single detached homes decreased by 2.8% to 44.7% of units sold and the share of condominium apartments rose by 2.8% to 29.1% of total units sold.  Expectations are that as more millennials begin to reach the age of home ownership, the trade-off between housing type and location will likely become more prevalent in the future across the GTA and this will also place a significant strain on inventory, turning the process of finding a home into an exercise in adjusting expectations.

According to Royal LePage’s most recent Market Survey Forecast, the company predicts that the aggregate price of a home in the GTA will appreciate by 6.8% by the end of 2018, as many purchasers become acclimatized to the new mortgage rules and continue to compete over low inventory levels, particularly in the condominium market where demand significantly exceeds supply due to the long lead times in building these units. 

If you are curious to know how much your property is worth today or how much you can afford to buy, please feel free to reach out; and if you found this article helpful please hit "Like" and "Share".


Comment

Are buyers rushing to avoid the stress?

1 Comment

Are buyers rushing to avoid the stress?

It appears that home buying activity in the GTA is ramping up for a strong December if the November results are any indication.  The Toronto Real Estate Board reported 7,374 transactions through TREB’s MLS system in November, bucking the regular seasonal trend which usually sees transactions slow in the last couple of months of the year.

It’s possible that the changes to mortgage lending guidelines, which come into effect in January (the “stress test”), have prompted some households to speed up their home buying decisions before their home choices become more limited as affordability will drop when the new rules are applied.

TREB reported that there were 18,197 active listings across the Greater Toronto Area (“GTA”) in the month of November, an increase of over 110%  compared to the same month in 2016 and inventory remained stable at roughly 2 ½ month’s supply.

What is more interesting, however, is what happened on a micro level.  In the City of Toronto, for instance, there were 2,978 reported transactions, representing 40% of the GTA total, but with only 5,430 active listings, available inventory was much lower than the GTA average, at 1.8 months.  Another interesting statistic is that detached homes represented almost 60% of the active listings in November, meaning that there is a much greater supply at the higher end of the price range, where inventory stood at almost 3 ½ month’s supply, or an additional 1 month above the GTA average.

Demand continued to be strongest at the lower end where inventories of the more affordable home types were 1.8 months for semi-detached homes, and 1.6 months for condominiums.

The average selling price in the month of November for all homes types combined was $761,757 - down by 2 per cent compared to the month of November, 2016, due in part to a smaller share of detached home sales versus last year.  On a year to date basis, however, the average selling price was up by 13.4 per cent compared to the same period last year, with high density home types (i.e. condo townhouses and apartments) leading the way in terms of price growth.

My predictions?  Look for a more active than usual December month as buyers continue to speed up their home buying decisions to “avoid the stress” that will be caused by the new mortgage lending qualification rules and the likelihood of further interest rate hikes in 2018.  The first 90 days of 2018 will probably lead to a slowdown in transactions as buyers navigate the new regulatory landscape and inventories will likely edge up to slightly more than 3 month’s supply on average for the next few months.

Wishing you happiness, good health and prosperity in the New Year!

If you are curious to know how much your property is worth today or how much you can afford to buy, please feel free to reach out; and if you found this article helpful please hit "Like" and "Share".

1 Comment

More Inventory Starting to Attract More Buyers

Comment

More Inventory Starting to Attract More Buyers

IT LOOKS LIKE THE WORST IS OVER FOR THE TORONTO HOUSING CORRECTION

Last month I spoke about how the Greater Toronto Area Real Estate Market is beginning to change shape and return to balance. Well, the evidence is in, as the number of new listings entered into The Toronto Real Estate Board’s MLS® System amounted to 16,469 in September – up by 9.4 per cent year-over-year.  But the real story is that total active listings stood at 19,021, a whopping 69% increase year-over-year.  TREB suggests that the improvement in listings in September compared to a year earlier is a sign that home owners are anticipating an uptick in sales activity as we move through the fall, or put another way, more inventory is starting to attract more buyers back to the market.

TREB announced that Greater Toronto Area REALTORS® reported 6,379 sales through TREB’s MLS® System in September, roughly the same amount as in August, but 35 per cent lower than September of last year.  In a balanced market, buyers take longer to make up their minds, as there is more product available to choose from.  Likewise, sellers need time to get adjusted to the new market reality.  Remember, the last few years were anything but “ordinary”.

Think of it this way.  Last year at this time, inventory (the number of active listings on MLS®) stood at approximately one month of sales.  So, on average, every home on the market was selling within a month or less, with multiple offers driving up the price paid due to the scarcity of supply.  Now that inventory is closer to 3 months supply, what this means is that 1 out of every 3 houses on average is selling within the month, and price is no longer being dictated by the frenzy we saw when homes were in such short supply.  So it makes sense to see that sales are about a third lower in September 2017 than they were in September of last year.  All of this is happening against a backdrop where average prices are still increasing, albeit at a lower rate than we saw during the run up.  The average selling price of a home in the GTA in September 2017 was $775,546 – up 2.6 per cent compared to September 2016.

However, the exception continues to be the condominium apartment market segment, where average prices were up on average by 23 per cent compared to last year. TREB reported in September that “tighter market conditions for condominium apartments follows consumer polling results from the spring that pointed toward a shift to condos in terms of buyer intentions”. In fact, condos accounted for almost 30 per cent of all MLS home sales across the GTA during the month of September, whereas detached homes – the most expensive market segment on average - accounted for a smaller share of overall transactions this year compared to last.

If you are curious to know how much your property is worth today, please feel free to reach out and if you found this article helpful please hit "Like" and "Share".


Comment