Viewing entries tagged
TORONTO REAL ESTATE MARKET

GTA Housing Sales and Price Growth Continues in August

Comment

GTA Housing Sales and Price Growth Continues in August

Greater Toronto Area housing sales of 6,939 units increased by 8.5% in August, 2018, compared to August, 2017 when 6,306 unit sales were recorded.  The average price of a home in the GTA also rose by 4.7% year over year and now stands at $765,270, compared to $730,969 in August 2017.  Month-over-month sales and price growth also continued in August and the annual rate of sales growth outpaced the annual rate of new listings growth.

Detached home sales were up by over 16% on a year-over-year basis in August, substantially more than the 1.6% increase in the other less-expensive semi-detached, townhome and condominium segments of the market.

Screen Shot 2018-09-09 at 11.17.56 AM.png

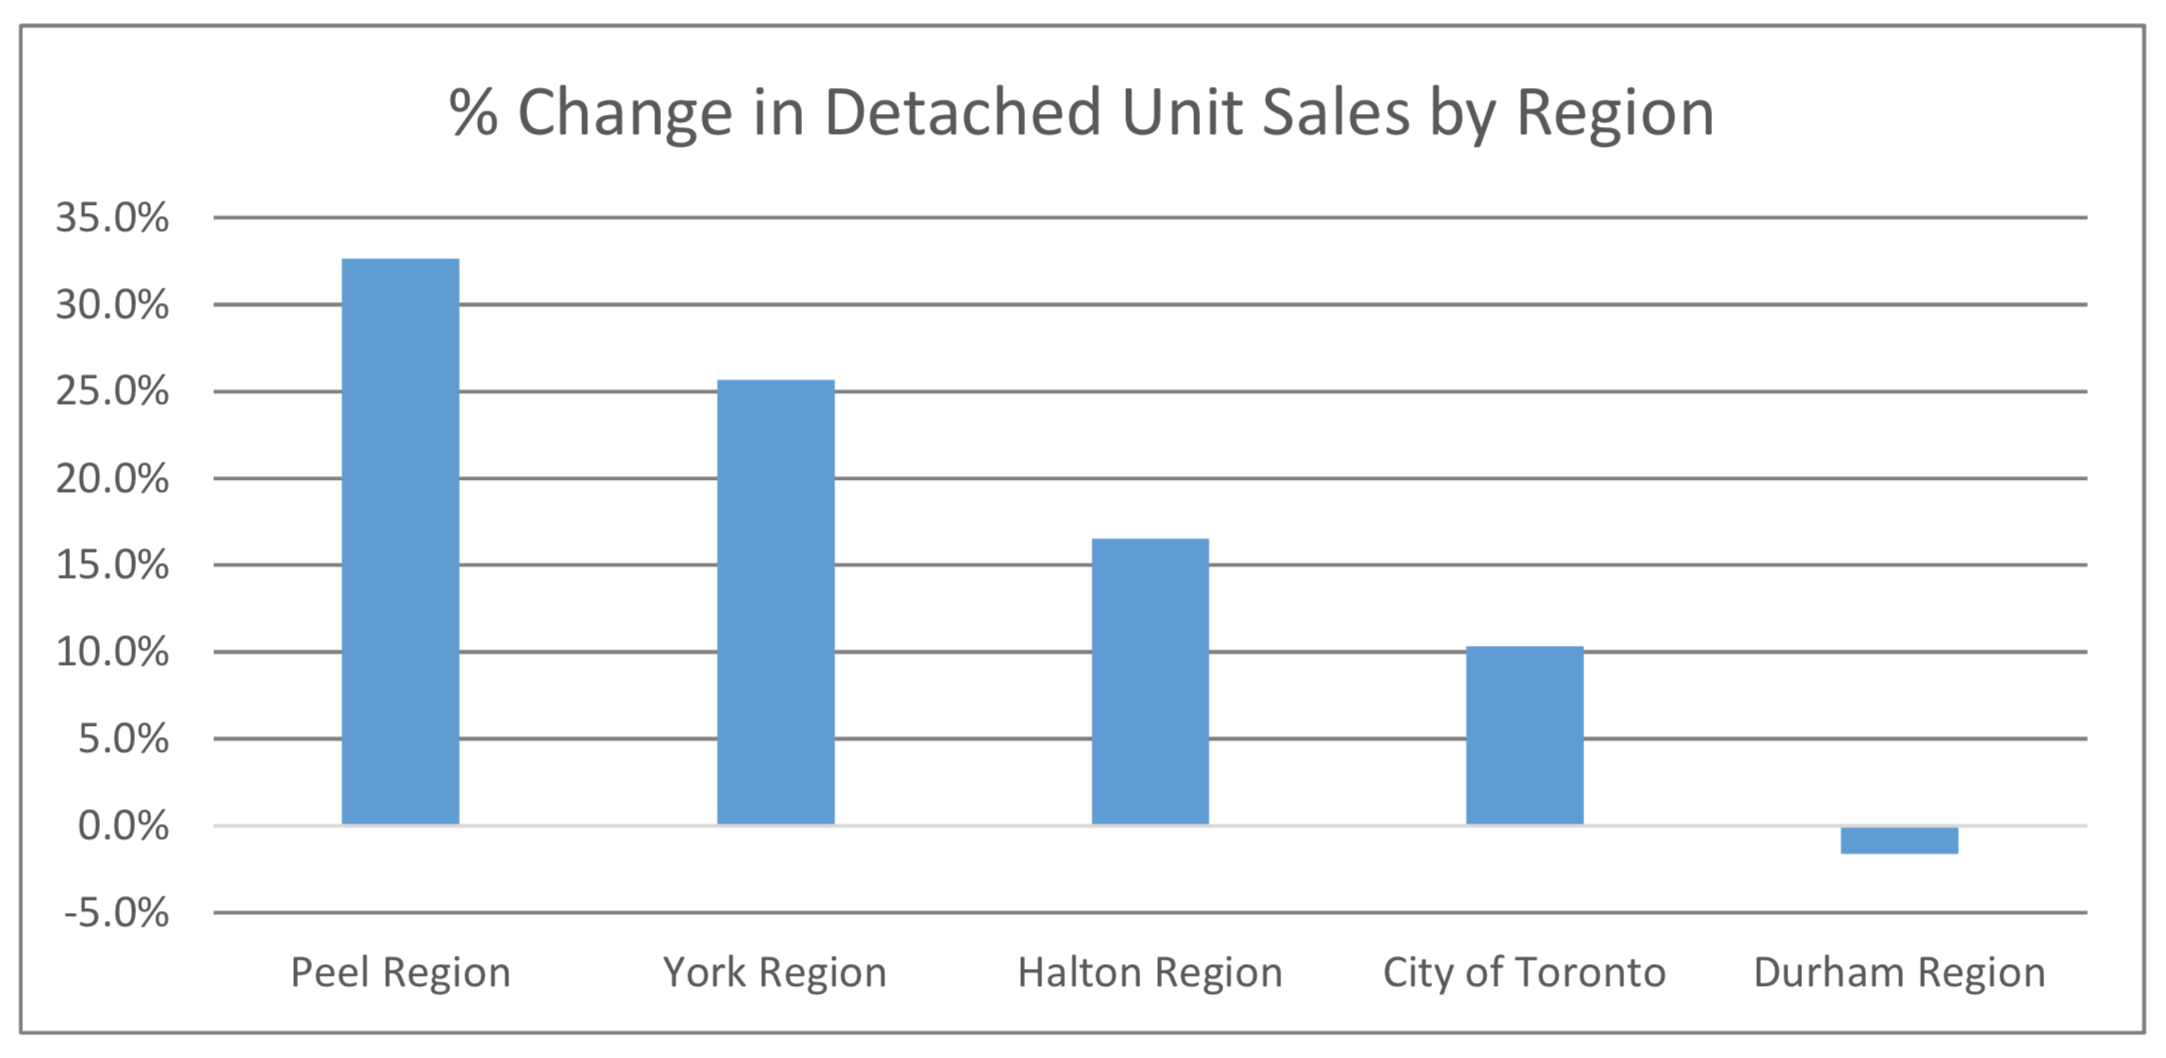
The 905 Regions surrounding the City fuelled most of this growth in detached unit sales, particularly in the Peel and York Regions, which recorded increases in detached unit sales of 32.6%, and 25.7%, respectively, as seen in the chart below.  In the City of Toronto (416) detached unit sales increased by 10.3%.

Screen Shot 2018-09-09 at 11.18.46 AM.png

Conversely, the City of Toronto is where average sales prices increased the most, at 8.1% year-over-year.  Prices also rose by 7.6% in Peel Region, while other areas of the GTA mostly experienced a percentage decrease in average selling prices.

There is now only slightly more than  2 ½ months inventory in the GTA as a whole and less than 2 months of inventory in the City of Toronto.  Many GTA neighbourhoods continue to suffer from a lack of inventory, although this is more pronounced in the City of Toronto.  York Region (north of the City) continues to have the largest supply of homes available for sale at 4.3 months supply, while in Halton, Peel and Durham (the regions northwest, west and east of the City, respectively), inventories are only slightly higher than in the City, at 2.3 to 2.4 months supply.

Screen Shot 2018-09-09 at 11.21.15 AM.png

Ownership of a home remains a solid long-term investment in the GTA, a region where the economy remains strong and the population continues to grow.

If you would like to find out what these statistics mean to you, or if you are curious to know how much your property is worth today or how much you can afford to buy, please reach out. 

If you found this article helpful please hit "Like" and "Share".


Comment

May Market Report - Steady Price Growth in the GTA Housing Market

Comment

May Market Report - Steady Price Growth in the GTA Housing Market

In May, we saw a continuation of the steady price growth experienced in the Greater Toronto Area (GTA) housing market during the 4 previous months.  So far, in the first 5 months of 2018, average home prices in the GTA have increased by 9.6%, to $805,320.  Unit sales have also increased each month in 2018 - from 4,019 units in January, to 7,834 units in May.

As I mentioned in last month’s blog, the housing market conditions in 2018 are very different than the conditions experienced during the comparative period in 2017.  But beginning in May, and through the second half of 2018, the comparisons will become more meaningful, as May, 2017 was the first month last year when the impact of the foreign buyers tax began to effect a slowdown in the rate of price growth and market activity, following the frenzy in the months prior when prices were bid up to unreasonable levels due to short supply and speculation.  So for the first time, we have the impact of the foreign buyers tax in both monthly results year-over-year, which makes a May to May comparison a little more relevant.

It is interesting to note, therefore, that new listings were down by more than sales this May compared to last year, (26.2% versus 22.2%), meaning that competition heated up among buyers.  And there are indications from sellers that listing intentions are down significantly since the Fall, meaning the supply of homes available for sale could continue to be an issue in the latter half of 2018.  And when the supply of homes decreases, prices increase, as competition among buyers intensifies.

This is particularly true in the City of Toronto (416) where, for example, average selling prices were at or above average listing prices for all major home types in May.  What is even more interesting, is that the further out you travel from Downtown Toronto, the weaker the market gets.  And since the GTA housing numbers are an average over the entire 416 and 905 regions, this proves how strong the market is right now in the City of Toronto, compared to the rest of the GTA, as the following chart shows:

Screen Shot 2018-06-14 at 4.14.17 PM.png

Finally, these last two charts highlight the composition of the May sales by home type in each of the 416 and 905 sub markets.  In the 416 region, condominiums accounted for a commanding 57% of unit sales and detached homes made up 25%, while in the 905 region it was detached homes that accounted for the majority of unit sales, at 55% of the total.  What these charts clearly indicate is that condominiums are the dominant force driving unit sales in the 416 region and are in high demand compared to higher priced detached homes, while the opposite is true in the 905 region where the inventory of detached homes tends to be more prevalent and buyers have more choice, which means these homes take longer on average to sell.

If you would like to find out what these statistics mean to you, or if you are curious to know how much your property is worth today or how much you can afford to buy, please reach out. 

If you found this article helpful please hit "Like" and "Share".

Comment

April Market Report  |  Which Headline Tells the True Story?

Comment

April Market Report | Which Headline Tells the True Story?

Average Selling Price for Homes in the GTA up 9.2% Year to Date, OR

Average Selling Price for Homes in the GTA down 12.4% in April Year-Over-Year?

Well, both are true actually.  But which one is more relevant?

I believe the first headline is more relevant, because it tells us what is happening in the current real estate market.  We already know that the GTA real estate market reset from its historical highs (in April, 2017 the GTA recorded the highest ever average selling price) after the introduction last year of the foreign buyers tax in Q2, followed by the more restrictive mortgage qualification rules introduced at the beginning of 2018.  Add to those measures the 2 successive increases in interest rates by the Bank of Canada and the market cooled down considerably.

Headlines are meant to grab the reader’s attention.  And one could argue that negative headlines tend to attract more attention than positive ones.  But the facts are that the GTA real estate market is trending positive, despite being off its historical highs.  Take a look at these statistics for the first 4 months of 2018:

Screen Shot 2018-05-08 at 2.03.08 PM.png

Unit Sales and Active Listings have increased in each month.  Average selling price is up 9.2% in four months.  Days on the Market have gone down by more than a third, and Average Selling Price to List Price is stable.  These are all signs of a healthy real estate market.

But the GTA real estate market is really a tale of 2 cities.  As reported by TREB in their latest Market Watch:

“The year-over-year change in the overall average selling price has been impacted by both changes in market conditions as well as changes in the type and price point of homes being purchased.  This is especially clear at the higher end of the market.  Detached home sales for $2 million or more accounted for 5.5% of total detached sales in April 2018, versus 10 per cent in April 2017.”

The differences in the composition of the current GTA real estate market can seen by looking at the following statistics broken down by major home type:

Screen Shot 2018-05-08 at 2.02.42 PM.png

There is roughly a 3 month supply of detached homes for sale in the GTA, whereas there is only a 1 ½ month supply of condominium units for sale. As well,  the increase in Average Selling Price for Condominiums, at 10.2% for the first four months of 2018, is outpacing the rate of increase for Detached homes, at 6.1%, as there is obvious pressure at the lower end with Condominiums in short supply.  TREB expects that “once we are past the current policy-based volatility, home owners should expect to see the resumption of a moderate and sustained pace of price growth in line with a strong local economy and steady population growth”.

If you would like to find out what these statistics mean to you, or if you are curious to know how much your property is worth today or how much you can afford to buy, please reach out.

If you found this article helpful please hit "Like" and "Share".

Comment