Viewing entries in
ROI

Very strong year-over-year sales and price growth in February

Comment

Very strong year-over-year sales and price growth in February

February market Stats #lubabeley.png

Serious inventory shortage likely to be the single biggest driver for the Spring Market

TORONTO, MARCH 4, 2020 – In line with the forecast contained in the Toronto Regional Real Estate Board’s recently released Market Year in Review and Outlook Report, TRREB President Michael Collins announced a very strong year-over-year sales and price growth in February 2020.

Greater Toronto Area REALTORS® reported 7,256 residential transactions through TRREB’s MLS® System in February 2020, representing a 45.6 per cent increase compared to a 10-year sales low in February 2019. However, February 2020 sales were still below the 2017 record result. Year-over-year sales growth, for the GTA as a whole, was strongest for ground-oriented home types.

After preliminary seasonal adjustment, February 2020 sales also exhibited positive momentum, up by 14.8 per cent compared to January 2020.

New listings amounted to 10,613 in February 2020, a 7.9 per cent increase compared to February 2019. This moderate annual growth rate was much smaller than that reported for sales, which means market conditions tightened considerably over the past year.

As market conditions tightened over the past year, competition between buyers has clearly increased. This resulted in a further acceleration in year-over-year price growth in February. The MLS® Home Price Index Composite Benchmark was up by 10.2 per cent. The average selling price for all home types combined was up by 16.7 per cent to $910,290. Double-digit average price growth was experienced for most major market segments, including detached houses and condominium apartments.

As shown in this 10 year summary of TRREB activity, February 2020 sales have recovered to 95% of February 2016 levels. However, February 2016 saw activation of 6% more new listings than this February, in a year that ultimately saw 85,731 total transactions. Of even greater significance, February 2016 saw 24% more active listings versus this February overall, yet TRREB's forecast for 2020 is for 97,000 transactions or 13% more than occurred in 2016. All this points to increasing pressure to win insufficient product in an environment where buyers are returning post OSFI stress test adjustments, and a return to record low interest rates on the heels of last week's Bank of Canada announcement.

Screen Shot 2020-03-09 at 6.40.41 PM.png

If you would like to find out what these statistics mean to you, or if you are curious to know how much your property is worth today or how much you can afford to buy, please reach out. 

If you found this article helpful please hit "Like" and "Share".

*Image of Toronto - courtesy of Marco Manna.



Comment

Persistent supply crunch spurs price jump

Comment

Persistent supply crunch spurs price jump

Jan 2020 market stats:Luba Beley.png

TRREB President Michael Collins announced that Greater Toronto Area REALTORS® reported 4,581 home sales through TRREB’s MLS® System in January 2020 – up by 15.4 per cent compared to January 2019. On a preliminary seasonally adjusted basis, sales were up by 4.8 per cent compared to December 2019.

“We started 2020 where 2019 left off, with very strong growth in the number of sales up against a continued dip in the number of new and available listings. Tighter market conditions compared to a year ago resulted in much stronger growth in average selling prices. Steady population growth, low unemployment and low borrowing costs continued to underpin substantial competition between buyers in all major market segments,” said Mr. Collins.

The MLS® HPI Composite Benchmark price was up by 8.7 per cent compared to January 2019 – the highest annual rate of growth for the Benchmark since October 2017. The condominium apartment market segment continued to lead the way in terms of MLS HPI® price growth, but all home types experienced price growth above seven per cent when considering the TRREB market area as a whole. The average selling price in January was up by 12.3 per cent, driven by the detached and condominium apartment segments in the City of Toronto.

“A key difference in the price growth story in January 2020 compared to January 2019 was in the low-rise market segments, particularly with regard to detached houses. A year seems to have made a big difference. It is clear that many buyers who were on the sidelines due to the OSFI stress test are moving back into the market, driving very strong year-over-year sales growth in the detached segment. Strong sales up against a constrained supply continues to result in an accelerating rate of price growth,” said Jason Mercer, TRREB’s Director of Market Analysis and Service Channels.

If you would like to find out what these statistics mean to you, or if you are curious to know how much your property is worth today or how much you can afford to buy, please reach out. 

If you found this article helpful please hit "Like" and "Share".

*Image of Toronto - courtesy of Marco Manna.


Comment

More sales, less inventory, rising price growth trends continue

Comment

More sales, less inventory, rising price growth trends continue

Screen Shot 2019-11-06 at 4.19.07 PM.png

TORONTO, November 5, 2019 – Toronto Real Estate Board President Michael Collins announced that Greater Toronto Area REALTORS® reported 8,491 residential sales through TREB’s MLS® System in October 2019. This result represented a 14 per cent increase compared to 7,448 sales reported in October 2018. GTA-wide, sales were up on a year-over-year basis for all major home types.

“A strong regional economy obviously fuels population growth. All of these new households need a place to live and many have the goal of purchasing a home. The problem is that the supply of available listings is actually dropping, resulting in tighter market conditions and accelerating price growth,” said Mr. Collins.

The trend of annual growth in sales versus annual decline in new listings continued in October 2019, with new listings down by 9.6 per cent compared to October 2018. The resulting tighter market conditions compared to a year ago resulted in positive annual rates of price growth across all major market segments, from a GTA-wide perspective.

The MLS® Home Price Index Composite Benchmark was up by 5.8 per cent on a year-over-year basis in October 2019 – the strongest annual rate of growth since December 2017. The average selling price for all home types combined was up by 5.5 per cent to $852,142, compared to $807,538 in October 2018.

“As market conditions in the GTA have steadily tightened throughout 2019, we have seen an acceleration in the annual rate of price growth. While the current pace of price growth remains moderate, we will likely see stronger price growth moving forward if sales growth continues to outpace listings growth, leading to more competition between home buyers,” said Jason Mercer, TREB’s Chief Market Analyst.

If you would like to find out what these statistics mean to you, or if you are curious to know how much your property is worth today or how much you can afford to buy, please reach out. 

If you found this article helpful please hit "Like" and "Share".


Comment

The annual rate of price growth in September reached the highest point so far in 2019

Comment

The annual rate of price growth in September reached the highest point so far in 2019

Screen Shot 2019-10-17 at 10.04.10 AM.png

Toronto Real Estate Board President Michael Collins announced that Greater Toronto Area REALTORS® reported 7,825 sales through TREB’s MLS® System in September 2019. This result represented strong year-over-year sales growth of 22 per cent compared to 6,414 sales reported in September 2018. It is important to note, however, that sales remain well-below the record September 2016 peak of more than 9,800 sales.

On a preliminary seasonally adjusted basis, the September 2019 sales level remained virtually the same as the August 2019 result.

The supply of listings continued to be a concern in September 2019, with new listings down by 1.9 per cent year-over-year to 15,611. We have experienced multiple months this year wherein the annual rate of sales growth outpaced the annual rate of new listings growth, resulting in the overall number of active listings at month-end being well-below last year’s levels. This speaks to tightening market conditions and an accelerating annual rate of price growth.

“Demand for ownership housing increased throughout the spring and summer of 2019 compared to the very slow pace of sales experienced in 2018. That being said, many first-time buyers are still experiencing difficulty finding an affordable home. Federal parties vying for seats in the October election have pledged to alleviate affordability issues hampering first-time buyers with a variety of policy proposals. While these demand-side proposals are important, it is also important that all levels of government remain focused on promoting a sustainable supply of different housing types moving forward,” said Mr. Collins.

The annual rate of price growth in September reached the highest point so far in 2019. The MLS® Home Price Index (HPI) Composite Benchmark was up by 5.2 per cent on a year-over-year basis in September. The average selling price for all home types combined was up by a similar annual rate of 5.8 per cent to $843,115.

On a preliminary seasonally adjusted basis, the September 2019 average selling price was up by 1.2 per cent compared to August 2019.

“It is interesting to note that market conditions for detached homes have tightened over the past year. In many of the regions surrounding the City of Toronto, detached price growth was above the rate of inflation on an annual basis. Consumer polling conducted for TREB over the past few years has pointed out that many intending home buyers are still focused on ground-oriented housing. This points to the need for a greater diversity of housing types to bridge the gap between detached houses and condominium apartments,” said Jason Mercer, TREB’s Chief Market Analyst.

“Statistics Canada’s most recent national population estimate represented the highest twelve month population increase ever recorded. This growth was driven by immigration, of which the GTA was likely a key beneficiary due to its strong regional economy and diversity. As a result, the demand for all types of housing in the GTA – rental and ownership – will remain strong. This fact underpins the need for immediate and sustained action on housing supply,” said TREB CEO John DiMichele.


If you would like to find out what these statistics mean to you, or if you are curious to know how much your property is worth today or how much you can afford to buy, please reach out. 

If you found this article helpful please hit "Like" and "Share".


Comment

2019 August Sales Up, Active Listings Drop

Comment

2019 August Sales Up, Active Listings Drop

Screen Shot 2019-09-06 at 10.41.03 AM.png

7,711 home sales were reported through the Toronto Real Estate Board MLS in August 2019, representing a 13.4 per cent increase over August’s 2018 results.

Detached home sales in the 905 area showed the most significant increase of all property types with a 24.5 per cent rise year-over-year.

The federal government’s First-Time Home Buyer Incentive (FTHBI) that came into effect on September 2 may add further momentum, as the 905 area is anticipated to be a more likely beneficiary of the program than the 416 area.
Total Active Listings continue to be an important part of the story with a drop of available inventory across the board of 11.16 per cent from last year. The 416 area had under 30 per cent of the 15,870 Active Listings reported by TREB for August, indicating that the 905 is heating up faster than the City.

If you would like to find out what these statistics mean to you, or if you are curious to know how much your property is worth today or how much you can afford to buy, please reach out. 

If you found this article helpful please hit "Like" and "Share".

Comment

Summer GTA sales continue to rebound

Comment

Summer GTA sales continue to rebound

JULY 2019 STATS

8,595 home sales were reported through the Toronto Real Estate Board MLS in July 2019, continuing the trend of improved year over year sales with a 24.3 per cent jump from the same month a year earlier. The average selling price for all home types combined was up by just over 3 per cent over the same period and continues to be driven by higher density home types.

On average, single detached home prices remained lower than last year’s levels in the 416 area but had a modest increase of 2.5 per cent in the 905 region.

If you would like to find out what these statistics mean to you, or if you are curious to know how much your property is worth today or how much you can afford to buy, please reach out. 

If you found this article helpful please hit "Like" and "Share".

Comment

June market conditions tighten, renewed price growth in many segments

Comment

June market conditions tighten, renewed price growth in many segments

Screen Shot 2019-07-06 at 1.04.58 PM.png

8,860 home sales were reported through the Toronto Real Estate Board MLS in June 2019, continuing the trend of improved year over year sales with a 10 per cent jump from the same month a year earlier. The average selling price for all home types combined was up by 3 percent over the same period and continues to be driven by a combination of the low inventory of available properties being outpaced by sales.

Bank of Montreal senior economist Robert Kavcic notes that the statistics for June 2019 are “indicative of a market that has all but balanced out – the sales-to-new-listings ratio is close to the 10-year average again.”


If you would like to find out what these statistics mean to you, or if you are curious to know how much your property is worth today or how much you can afford to buy, please reach out. 

If you found this article helpful please hit "Like" and "Share".


Comment

May 2019 sales highest in 17 months

Comment

May 2019 sales highest in 17 months

Screen Shot 2019-06-07 at 10.14.50 AM.png

9,989 home sales were reported through the Toronto Real Estate Board MLS in May 2019, soaring almost 19 per cent from the same month a year earlier. May sales were the highest on a seasonally adjusted basis since December 2017 - up roughly 10 per cent from April which had a 16.8 per cent jump in year-over-year sales.

The average selling price for all home types combined was up by 3.6 percent over the same period. Lack of supply, however, continues to be an ongoing concern as year-over-year growth in new listings at just under 1% was significantly outpaced by sales.

If you would like to find out what these statistics mean to you, or if you are curious to know how much your property is worth today or how much you can afford to buy, please reach out. 

If you found this article helpful please hit "Like" and "Share".

Comment

Substantial year-over-year increase in April sales

Comment

Substantial year-over-year increase in April sales

April Market Report.png

9,042 home sales were reported through the Toronto Real Estate Board MLS in April 2019, a jump of 16.8 per cent compared to April 2018. The average selling price for all home types combined was up by 1.9 per cent over the same period – the strongest annual rate of growth so far in 2019.

Condos continue to trend as a positive driver of year-over-year price growth.

Active listings for the month dropped below levels seen in April 2018 and new listings are not keeping pace with sales - an environment that supports pricing acceleration. This, in combination with the OSFI mortgage stress test, represents a formidable challenge to the first time home buyer, the root of the real estate market. A report issued May 3rd by Canada Mortgage and Housing Corp. citing that there has been “improved alignment overall between house prices and housing market fundamentals” since the stress test was implemented, can be seen as an indicator of the government’s intent to keep the stress test in place for the foreseeable future.

If you would like to find out what these statistics mean to you, or if you are curious to know how much your property is worth today or how much you can afford to buy, please reach out. 

If you found this article helpful please hit "Like" and "Share".

Comment

Tighter market driving price growth

1 Comment

Tighter market driving price growth

Screen Shot 2019-03-06 at 3.50.05 PM.png

5,025 home sales were reported through the Toronto Real Estate Board MLS in February 2019, down by 2.4 per cent compared to February 2018.

The average selling price for all home types combined was up by 1.6 per cent over the same period.

The semi-detached segment was the best performer, with average prices rising 9.9 per cent on the year and condos continue to trend as a positive driver of year-over-year price growth. A decline of 6.2 per cent for new listings from a year earlier, however, is a concerning statistic that industry analysts suggest is being driven by the OSFI mortgage rules that are keeping buyers on the sidelines.

“The OSFI mandated mortgage stress test has left some buyers on the sidelines who have struggled to qualify for the type of home they want to buy. The stress test should be reviewed and consideration should be given to bringing back 30 year amortizations for federally insured mortgages. There is a federal budget and election on the horizon. It will be interesting to see what policy measures are announced to help with home ownership affordability,” said Mr. Bhaura, President of the Toronto Real Estate Board.

“Home sales reported through TREB’s MLS® System have a substantial impact on the Canadian economy. A study conducted by Altus for TREB found that, on average, each home sale reported through TREB resulted in $68,000 in spin-off expenditures accruing to the economy. With sales substantially lower than the 2016 record peak over the last two years, we have experienced a hit to the economy in the billions of dollars, in the GTA alone. This hit has also translated into lower government revenues and, if sustained, could impact the employment picture as well,” said Jason Mercer, TREB’s Director of Market Analysis and Service Channels.

If you would like to find out what these statistics mean to you, or if you are curious to know how much your property is worth today or how much you can afford to buy, please reach out. 

If you found this article helpful please hit "Like" and "Share".


1 Comment

Moderate year-over-year price increases, record square footage cost for pre-construction condos

Comment

Moderate year-over-year price increases, record square footage cost for pre-construction condos

January 2019 Market Report

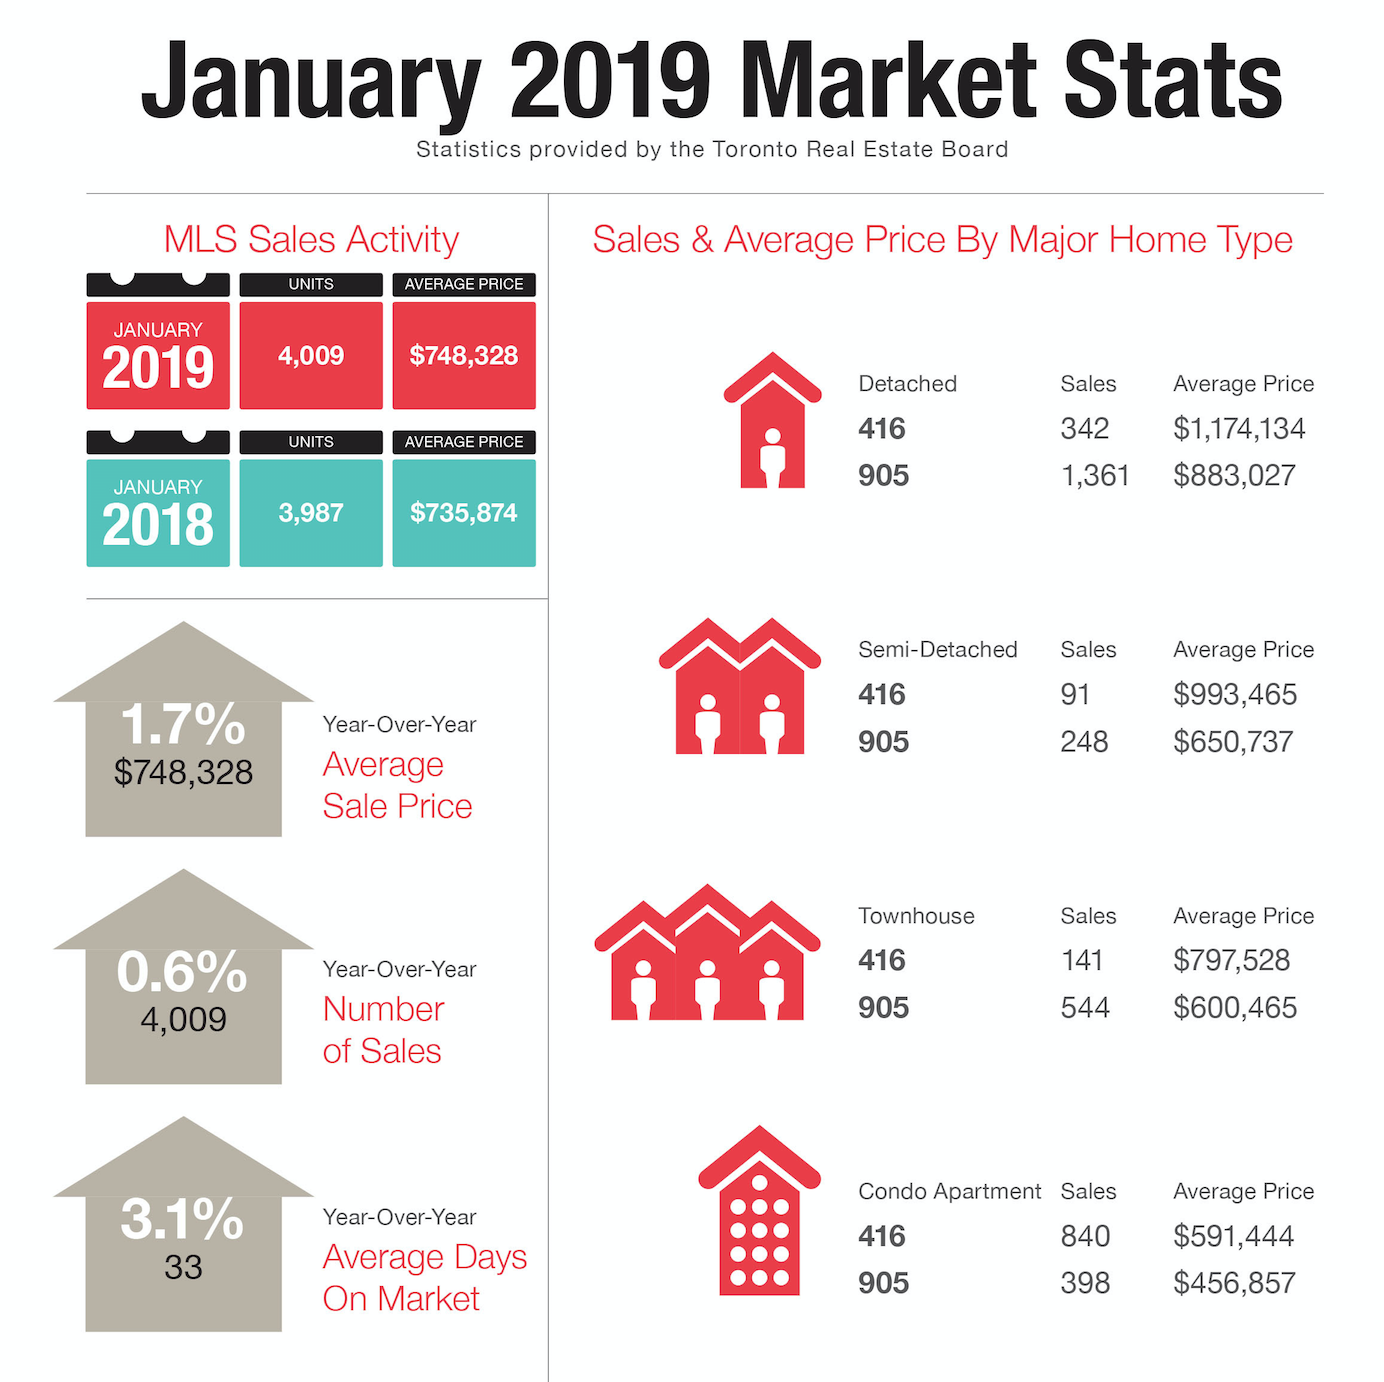
4,009 home sales were reported through the Toronto Real Estate Board MLS in January 2019, up by 0.6 per cent compared to January 2018. The average selling price was up by 1.7 per cent for the month year-over-year.

The first month of this year continues to show the condo market segment leading the way in terms of price growth. This segment is one to watch closely, as data released on February 1, 2019 by Urbanation Inc., which tracks data in the pre-construction condo market in the GTA, indicate that prices of pre-build condo units rose 16 per cent in 2018 to a record of $921 a square foot in the GTA over all, and $1,117 a square foot in central Toronto. Over the past two years, new construction condos prices have climbed by 56 per cent in the GTA, far outpacing price increases for resale condos.

Here you can see the real estate market behaviour for the last 5 years 2014 - 2018.

Here you can see the real estate market behaviour for the last 5 years 2014 - 2018.

January 2019 unit sales and inventories look very similar to Jan 2018

January 2019 unit sales and inventories look very similar to Jan 2018

Screen Shot 2019-02-10 at 8.38.23 PM.png
Months of Inventory is currently at 3 months, exactly how it was a year ago. We are still experiencing a seller’s market.

Months of Inventory is currently at 3 months, exactly how it was a year ago. We are still experiencing a seller’s market.

As you can see, Months of Inventory for Detached sector is a bit higher than it is for the Semi-Detached or Condominium properties due to affordability factor.

As you can see, Months of Inventory for Detached sector is a bit higher than it is for the Semi-Detached or Condominium properties due to affordability factor.

Months of Inventory for regions 416 & 905 in all categories.

Months of Inventory for regions 416 & 905 in all categories.

If you would like to find out what these statistics mean to you, or if you are curious to know how much your property is worth today or how much you can afford to buy, please reach out. 

If you found this article helpful please hit "Like" and "Share".


Comment

Mortgage stress test and low inventory influence November 2018 market activity

1 Comment

Mortgage stress test and low inventory influence November 2018 market activity

Screen Shot 2018-12-18 at 5.08.16 PM.png

November 2018 saw a 14.7 per cent drop in sales compared to November of 2017. Lower sales activity for the month year over year was anticipated as the looming imposition of new mortgage stress-test in January 2018 fueled a spike in sales activity at the end of 2017 from buyers wanting avoid the tougher rules. 

With the number of active listings down by 9.8 per cent year over year and a drop of 26.1 per cent in new listings for the period, lack of inventory continues be a key market influencer, pushing home prices up by 3.5%.

Sale prices for semi-detached properties improved the most, although lower-priced housing options such as condos and townhouses continued to show steady increases as influenced by the mortgage stress test restrictions and higher borrowing costs.

If you would like to find out what these statistics mean to you, or if you are curious to know how much your property is worth today or how much you can afford to buy, please reach out. 

If you found this article helpful please hit "Like" and "Share".


1 Comment

GTA Housing Market Conditions Tightened Further in October

1 Comment

GTA Housing Market Conditions Tightened Further in October

Luba+Beley+October+Market+Report.png

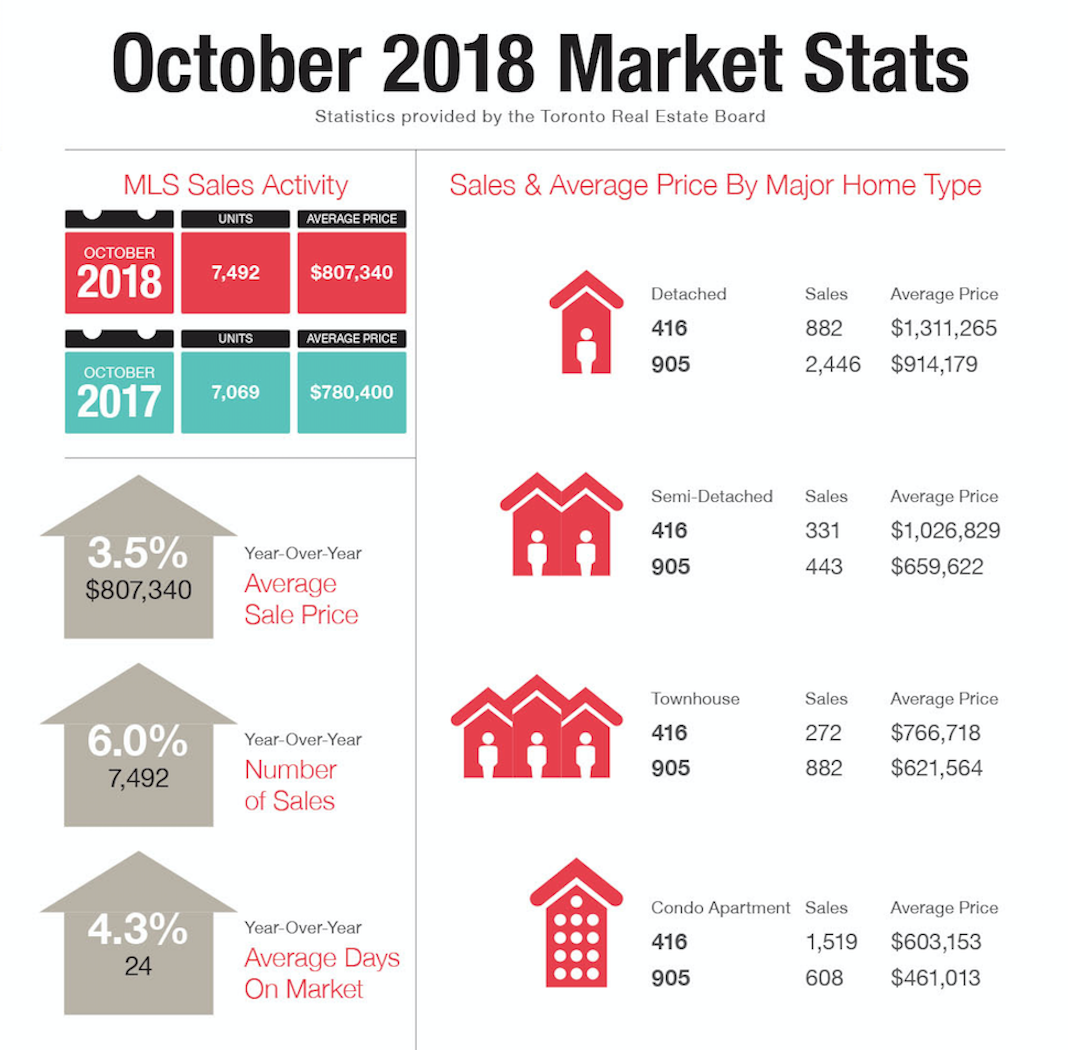
The Toronto Real Estate Board released results for October 2018, reporting tightening conditions in the GTA with sales up and new listings down.

Housing sales across the GTA rose last month compared to a year ago. Prices also rose, helped by strong sales in the condo market. The overall average selling price for all housing types in the GTA was $807,340, up 3.5% year over year. Condos were the housing type that experienced the greatest price growth with a 7.5% increase. 

A total of 7,492 sales of all housing types were reported throughout the MLS system in October, which is 6% higher than the same month last year. Condos further drove the October market in unit sales, where 1,519 condo units were sold in the 416 area in October, a result that was greater than the total number of units sold of all other housing types combined in the 416.  It was a very different story in the 905 regions of the GTA where combined sales of 3,771 detached, semi-detached and townhome units in the month outpaced condo units sold by over 6 to 1.


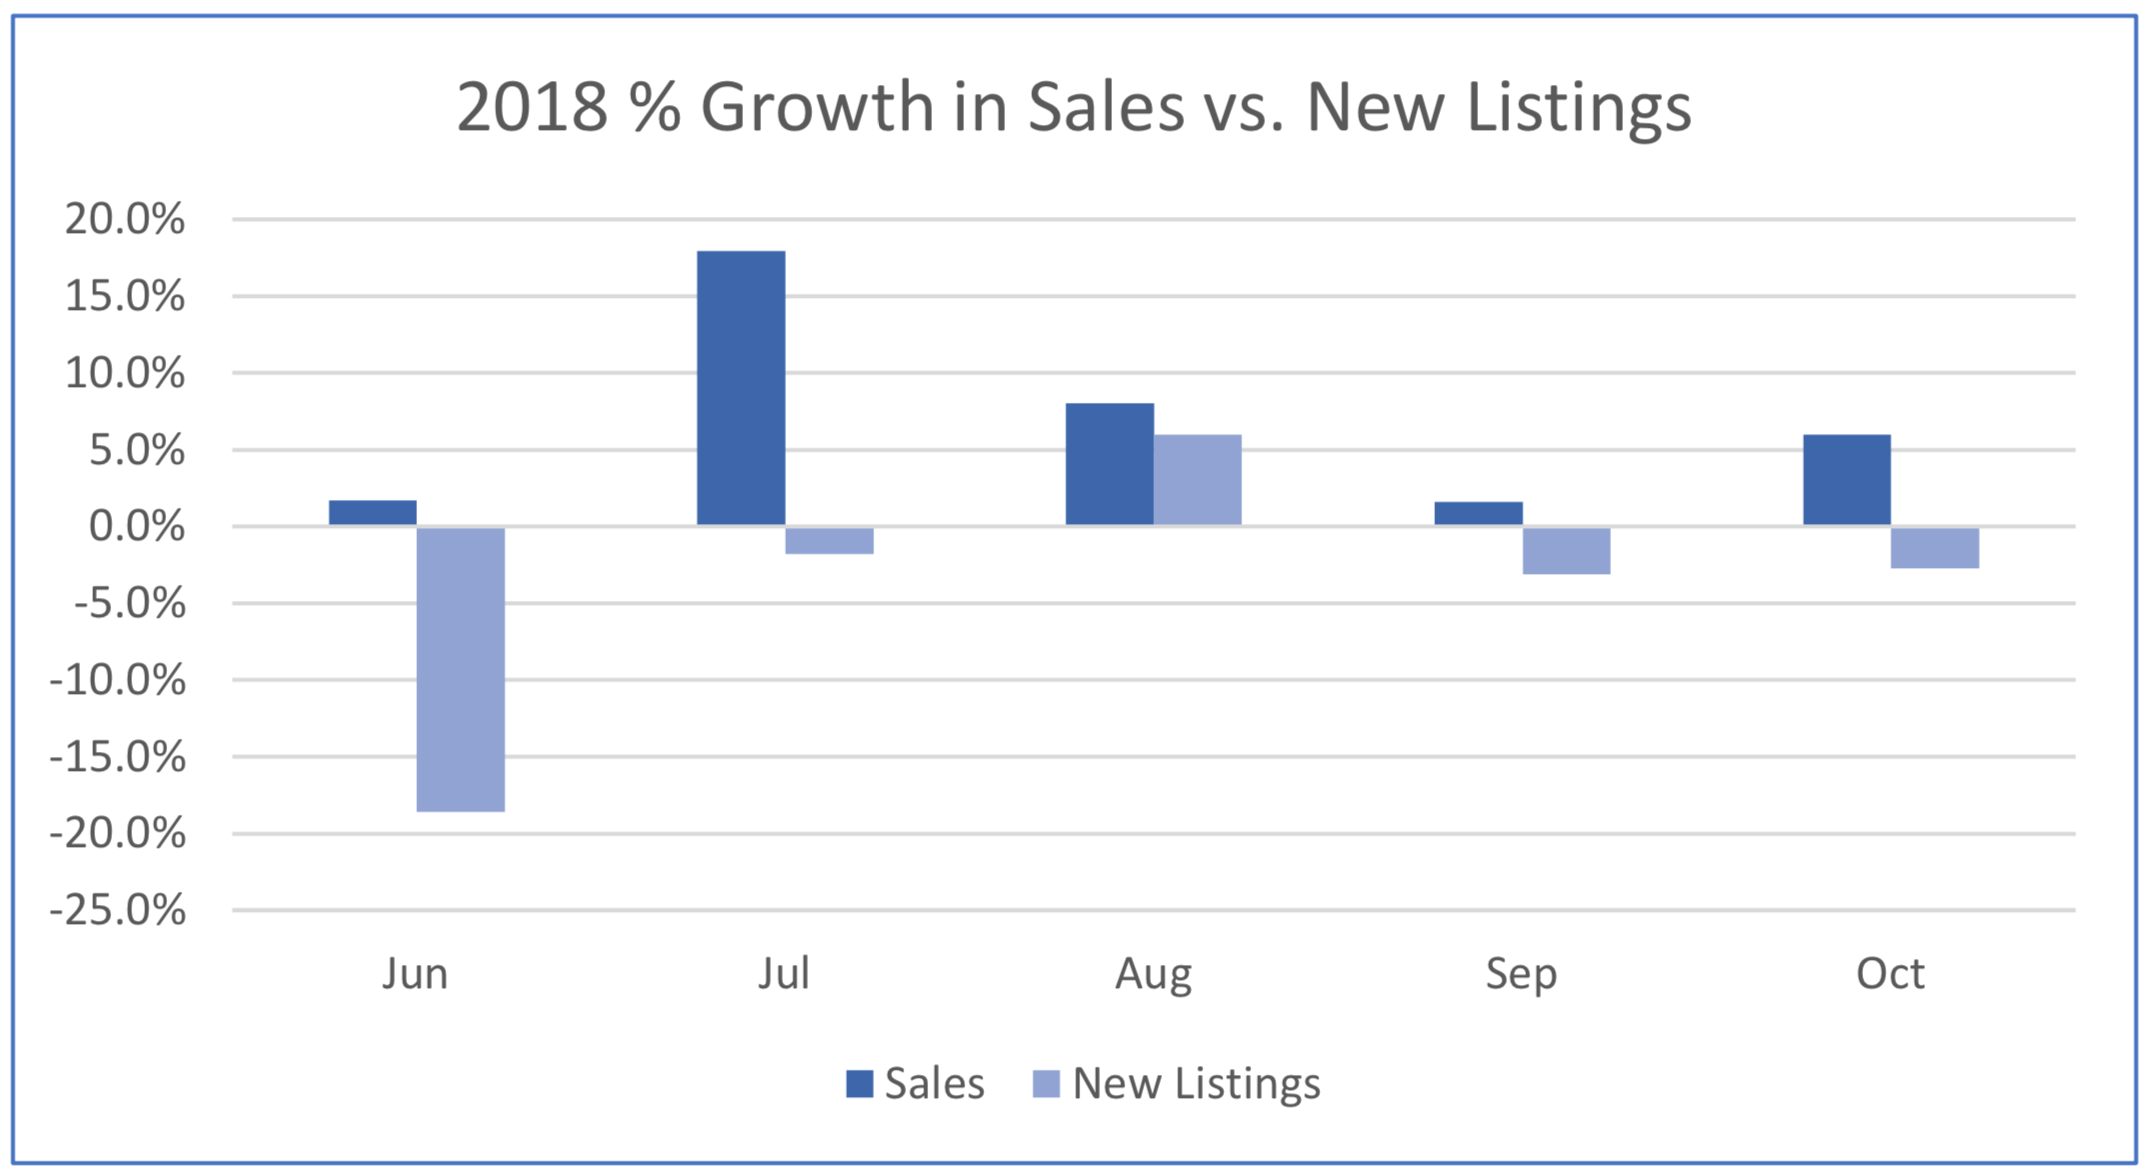
“Annual sales growth has outstripped annual growth in new listings for the last five months, underpinning the fact that listings supply remains an issue in the Greater Toronto Area” noted TREB’s Director of Market Analysis, Jason Mercer, and as seen in the graphic below.

Luba Beley Market Watch Oct 2018

If you would like to find out what these statistics mean to you, or if you are curious to know how much your property is worth today or how much you can afford to buy, please reach out. 

If you found this article helpful please hit "Like" and "Share".


1 Comment

GTA Housing Sales and Price Growth Continues in August

Comment

GTA Housing Sales and Price Growth Continues in August

Greater Toronto Area housing sales of 6,939 units increased by 8.5% in August, 2018, compared to August, 2017 when 6,306 unit sales were recorded.  The average price of a home in the GTA also rose by 4.7% year over year and now stands at $765,270, compared to $730,969 in August 2017.  Month-over-month sales and price growth also continued in August and the annual rate of sales growth outpaced the annual rate of new listings growth.

Detached home sales were up by over 16% on a year-over-year basis in August, substantially more than the 1.6% increase in the other less-expensive semi-detached, townhome and condominium segments of the market.

Screen Shot 2018-09-09 at 11.17.56 AM.png

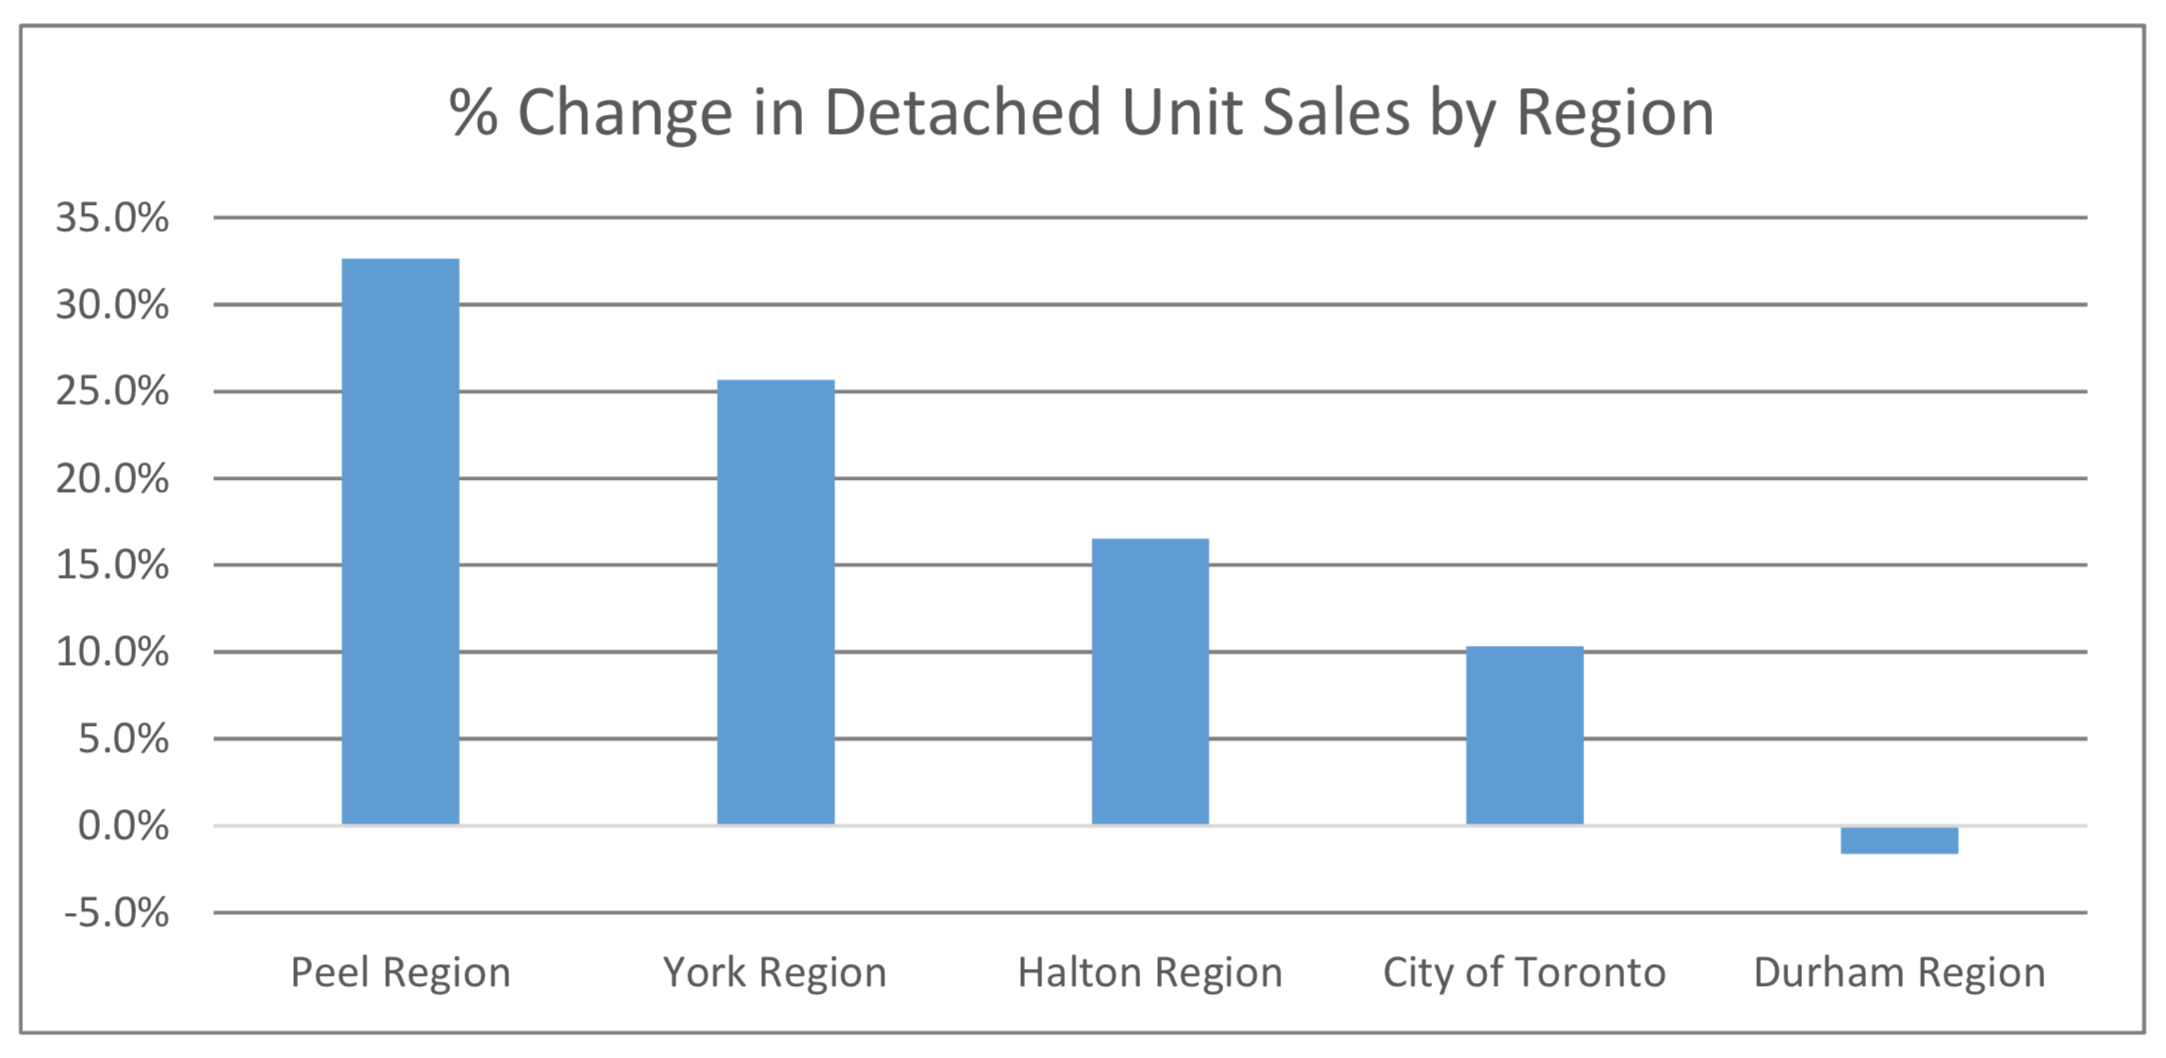
The 905 Regions surrounding the City fuelled most of this growth in detached unit sales, particularly in the Peel and York Regions, which recorded increases in detached unit sales of 32.6%, and 25.7%, respectively, as seen in the chart below.  In the City of Toronto (416) detached unit sales increased by 10.3%.

Screen Shot 2018-09-09 at 11.18.46 AM.png

Conversely, the City of Toronto is where average sales prices increased the most, at 8.1% year-over-year.  Prices also rose by 7.6% in Peel Region, while other areas of the GTA mostly experienced a percentage decrease in average selling prices.

There is now only slightly more than  2 ½ months inventory in the GTA as a whole and less than 2 months of inventory in the City of Toronto.  Many GTA neighbourhoods continue to suffer from a lack of inventory, although this is more pronounced in the City of Toronto.  York Region (north of the City) continues to have the largest supply of homes available for sale at 4.3 months supply, while in Halton, Peel and Durham (the regions northwest, west and east of the City, respectively), inventories are only slightly higher than in the City, at 2.3 to 2.4 months supply.

Screen Shot 2018-09-09 at 11.21.15 AM.png

Ownership of a home remains a solid long-term investment in the GTA, a region where the economy remains strong and the population continues to grow.

If you would like to find out what these statistics mean to you, or if you are curious to know how much your property is worth today or how much you can afford to buy, please reach out. 

If you found this article helpful please hit "Like" and "Share".


Comment

More Signs that Toronto Area Real Estate Market is in Recovery Mode

1 Comment

More Signs that Toronto Area Real Estate Market is in Recovery Mode

Year-over-year resale home prices and sales rose for a second consecutive month in July, signalling that the Toronto area real estate market is in recovery mode.

Average selling prices climbed 4.8% to $782,129 last month, up from $745,971 in the same period last year and the number of homes sold rose 18.6% to 6,961 units, compared to 5,869 homes sold in July, 2017.

Condominiums continued to outperform low rise housing such as detached, semi-detached and townhomes.  On average last month condo prices rose 8.9% across the GTA to $546,984.  What is interesting to note, however, is that even though roughly 70% of the condos sold last month were in the City of Toronto (416), the rate of price appreciation has been shifting in favor of the suburban markets (905), where prices were up by 10.3%  in July, compared to 9.2% for the City of Toronto.  This is a dramatic shift from the month of June, when condominium prices in Toronto rose by more than 9% while the suburban markets only posted price appreciation of less than 4%. A condominium in Toronto cost $582,547 on average, compared to $461,255 in the surrounding regions.

Screen Shot 2018-08-06 at 1.38.55 PM.png

Year-over-year prices for detached homes, rose by 0.5% on average in July to $1,004,647, but the scarcity of detached homes listed for sale in Toronto helped boost prices by 3.6% inside the City, while prices remained flat in the surrounding 905 communities where roughly 3/4 of all the detached home sales were recorded.  A detached house in Toronto cost $1,350,700 on average, compared to $907,347 in the surrounding regions.

Screen Shot 2018-08-06 at 1.39.09 PM.png

Months of inventory across all home types in the GTA stood at roughly 2.8 months supply in July compared to 2.4 months supply a year earlier, but the numbers look very different when viewed by housing type and location.  As seen in the chart below, months of inventory of detached homes are roughly double that of any other housing type, and this is even more pronounced when one compares Toronto to the surrounding regions where inventories across all housing types are generally about one month higher than in the City.

Screen Shot 2018-08-06 at 1.39.09 PM.png

If you would like to find out what these statistics mean to you, or if you are curious to know how much your property is worth today or how much you can afford to buy, please reach out. 

If you found this article helpful please hit "Like" and "Share".

1 Comment

GTA Housing Statistics Turn the Corner in June

2 Comments

GTA Housing Statistics Turn the Corner in June

Home sales in the Greater Toronto Area (GTA) were 2.4% higher in June 2018 than they were in June 2017, and the average selling price edged up on a year over year basis by 2%.  This is the first time since 2016 that unit sales increased year over year and now reverses the year on year trend of declining monthly unit sales seen every month since April 2016.   And new listings dropped from those recorded in June of last year by 18.6%, meaning that market conditions appear to be tightening, signalling that the housing market has turned the corner to a more positive course, as sales accounted for a 10.4% greater share of listings, up from 40.4% of active listings in June 2017 to 50.8% in June 2018.

Screen Shot 2018-07-05 at 3.30.43 PM.png
Screen Shot 2018-07-05 at 3.32.25 PM.png

There was also a change in the mix of properties sold in June 2018 compared to June 2017, with low-rise home types accounting for a greater share of sales at 63.2% this year compared to 61.0% last June.  Sales of Detached and Semi-Detached homes were up by 5.5% and 8.1%, respectively, year-over-year in June, while condominium unit sales decreased by 5.3% in the same period.

All of this is happening as a result of that fact that home buyers are starting to move back into the market, after adjusting to the regulatory impacts of the foreign buyers tax which took effect in April last year, and the generally higher borrowing costs and new mortgage qualification stress tests that followed.  The expectation is that we will see continued improvement in sales over the next year, although it is likely that issues related to the supply of listings will persist, leading to increased upward pressure on home prices as competition among buyers intensifies.

Finally, it is interesting to note that unit sales and selling prices were up in each and every month in 2018, reversing the trend that started in April of last year when the impact of the foreign buyers tax negatively impacted both numbers until housing activity rebounded somewhat in the fourth quarter, when buyers rushed to secure home ownership prior to the new stress tests coming into effect in January of 2018.   As the chart below also demonstrates, home ownership has proven to be a positive long-term investment.

Screen Shot 2018-07-05 at 3.33.22 PM.png

If you would like to find out what these statistics mean to you, or if you are curious to know how much your property is worth today or how much you can afford to buy, please reach out. 

If you found this article helpful please hit "Like" and "Share".


2 Comments

Kitchen renovation has greatest potential to boost a property’s sale price

Comment

Kitchen renovation has greatest potential to boost a property’s sale price

TORONTO, JUNE 28, 2018 – According to a cross-Canada survey of over 750 Royal LePage real estate experts, a kitchen renovation is the clear upgrade of choice with the potential to boost a property’s value by more than 12.5 per cent.[1] Both ranking second, a finished basement or a new bathroom has the potential to increase a property’s value between 2.5 per cent and 12.5 per cent, depending on the investment.

“To financially benefit from a home improvement project, you need to keep potential homebuyers in mind,” said Tom Storey, real estate agent, Royal LePage Signature Realty. “While updating a kitchen should increase your sale price, a pool can actually deter families with young children or those who are looking for less maintenance.”

Adding a pool or deck is considered the least worthwhile renovation to increase a property’s value with pricing potential limited to a maximum of 2.5 per cent of the value of the home.

For Canadians looking for more general guidance on where to focus their home projects, the vast majority of surveyed experts recommended interior renovations (95.0%) over exterior renovations (5.0%).

“Curb appeal is important but more time is spent indoors at the open house and that is where buyers typically fall in love with a home,” added Storey. “When renovating with the potential to sell, the most important thing to remember is to use colours and materials that are popular and not too personal.”

The survey showed that prospective sellers are willing to invest less than 2.5 per cent of a property’s value on home renovations prior to listing their home, which represents an investment of up to $15,138 on a property valued at $605,512[2] – the current median home price in Canada.

When asked which generation is the most likely to renovate their home, 45.1 per cent of surveyed experts said baby boomers, as many are planning to sell and downsize. They are also most likely to have the funds needed for a significant renovation.

“Baby boomers run the risk of their property selling for a lower price or languishing on the market for longer than expected if they held their property for a long period of time without updating periodically,” said Storey. “Although many buyers can see themselves making home improvements themselves, its very hard for a buyer to get excited or imagine living in a space that is run down or the decor reflects another generation.”

Popular Home Improvements

About the home renovations ROI survey.

The Royal LePage Home Improvement Survey polled 766 real estate advisors from across Canada, between June 20, 2018 and June 25, 2018. Each respondent was asked to complete an online survey composed of 8 questions on the value of popular home improvements.

[1] Statistic referenced in table Popular Home Improvements

[2] National Home Price Aggregate, Royal LePage House Price Composite, Q1 2018.

This article is curtesy of www.royallepage.ca.

I offer complimentary home evaluations. Please do not feel obliged to list and sell with me when you request your current home evaluation. I am always happy to help, and when you are ready, I will be available to provide you with my full real estate experience.

Request your home evaluation:

PLEASE CALL/TEXT AT 416-419-5226 OR EMAIL LUBA@LUBABELEY.COM

Comment

15-step Action Plan to optimize your ROI when Selling Your Home

1 Comment

15-step Action Plan to optimize your ROI when Selling Your Home

IT’S WAY MORE THAN JUST PUTTING A SIGN ON YOUR LAWN!

Is this the year you are planning to move? Every home owner arrives at this point sooner or later. It’s a big decision involving a major financial transaction so, when the time comes, you want to do it right.

If you, or anyone you know, is planning a move, here’s a 15-step action plan that can make the process easier and less stressful. 

How to get your home sold fast, at a premium price?

For most people buying a home is the single biggest investment they’ll ever make. When viewed as an investment, your home offers a major advantage over stocks, bonds, and mutual funds. The profits you make on all of these investments are subject to capital gains taxes.

That’s not the case when selling your home. Any profits you make from selling your principal residence are tax-free. So, when you decide to sell, it’s worth making an extra effort to capitalize on this special opportunity to make a sizable tax-free profit.

Because profits from the sale of your home are tax free, it makes good sense to invest in upgrades before selling. In many cases you can get a 100% plus return – over just a few weeks or months – on the funds you invest to upgrade, or renovate your home, prior to selling.


15-STEP ACTION PLAN TO OPTIMIZE YOUR ROI:


1.  Choose your REALTOR® carefully

Without a doubt, it is up to you to source the best representation for yourself. 

Today consumers get most of their information through their mobile phone, PC or a tablet. Be sure your real estate sales person/broker has a strong online presence, and utilizes state-of-the-art digital marketing tools including email, Facebook and Instagram.

Tips on How to Improve your property value here.

2.  Audit your agent’s marketing efforts

92% of homebuyers start the house hunting process online. What your agent posts online to describe your home is vitally important. If the agent’s description isn’t compelling, most house hunters won’t take the trouble to visit the property. Lots of quality pictures are important too. Make sure your agent uses a professional high-end photographer that knows how to capture the best features of your home. A great description and stunning pictures will make your home stand out in crowd and drive buyer traffic.

3.  Plan the time to sell when markets are hot

Like everything else real estate markets are cyclical. Prices may vary by 5% or more between the peak and lowest periods over any given year. A good Realtor can help you determine the best time to list your home.

4.  Pricing your home to sell

When a home is priced too high, it may remain unsold for a period that’s more than other properties in the same neighborhood. This will cause prospective buyers to think there’s something wrong, further dampening demand for the property.

When pricing your home it’s important to follow your agent’s advice. A good agent will know the pricing strategy to get you the best deal.

5.  Exterior staging

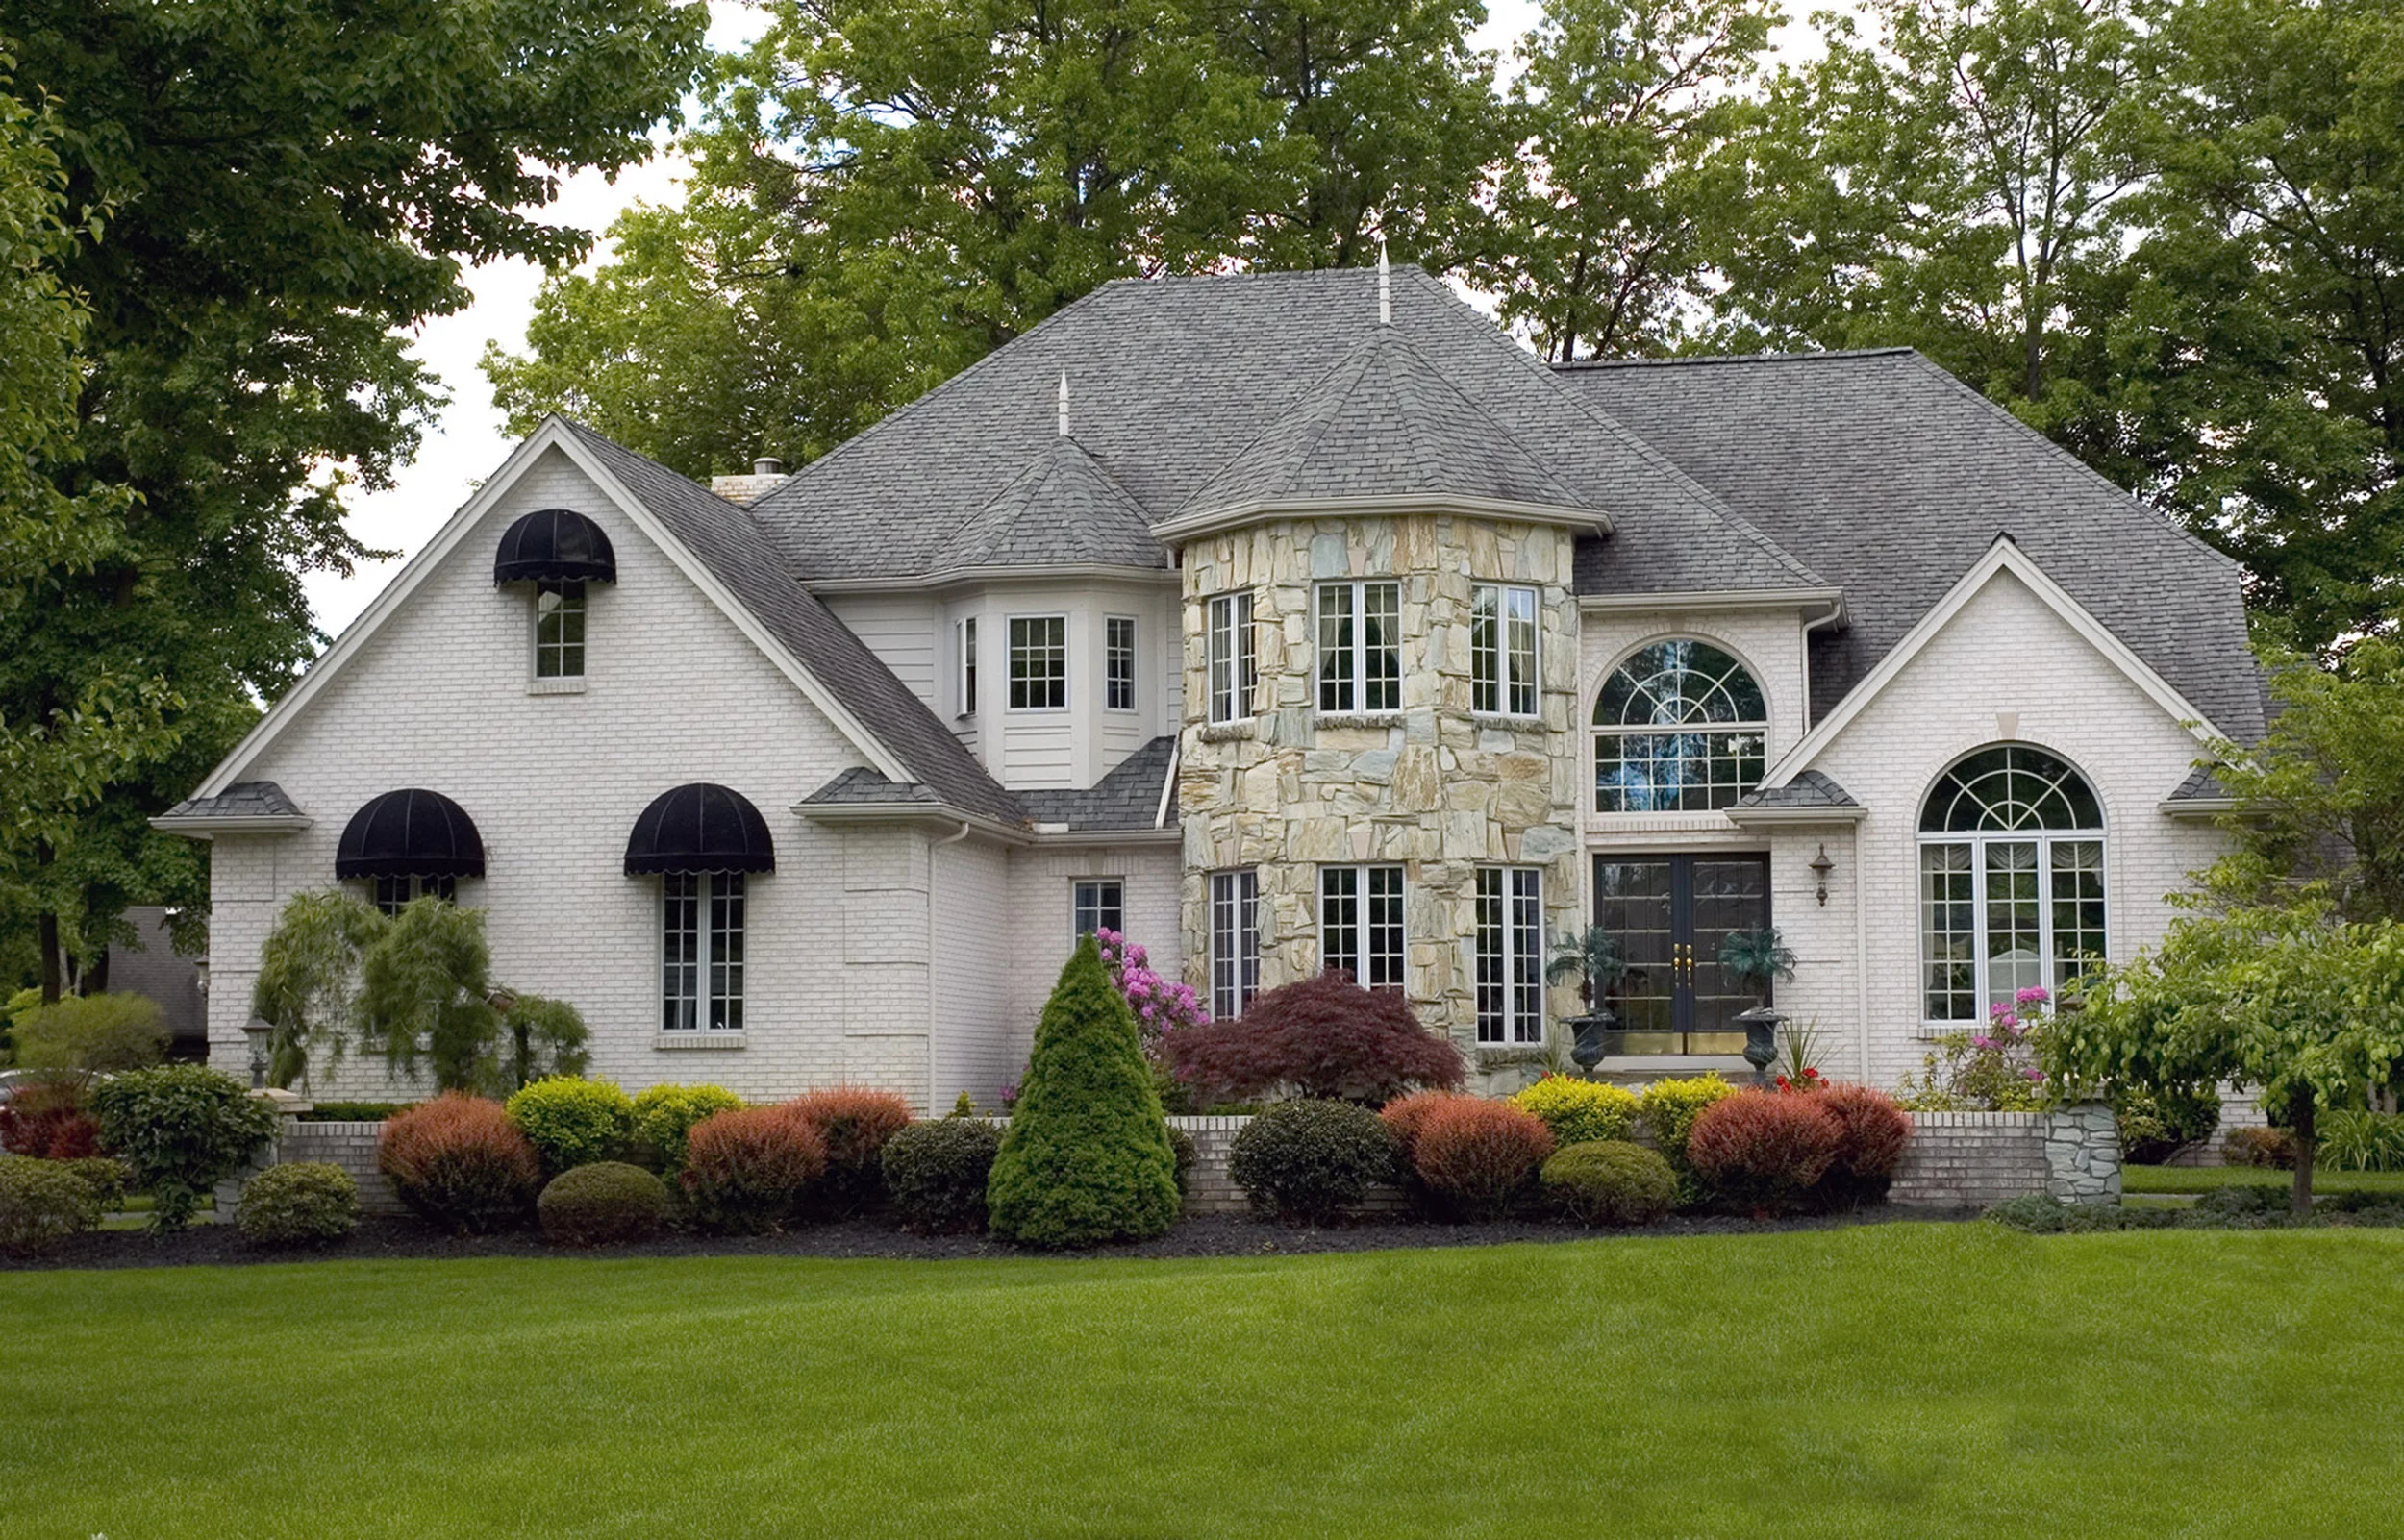
First impressions are important when selling a home. If the exterior of your home looks shabby or run down, prospective buyers are turned off before they go through the front door. Before putting it on the market, be sure to spruce up your home’s exterior. Cut the grass, be sure the garden is weed free, and edged so it looks cared for. Repaint trim around the windows and the front door. Make sure the curb appeal suggests a cared for and well maintained home.

Tip: If you are planning to sell in the winter be sure to take some summer photos of the gardens, front and back yards.

P9220255.jpg

6.  Interior staging

This can involve renting furniture or classy art to hang on the walls of your home, placing fresh flowers in the living room and kitchen, and re- arranging furniture. Many agents offer free interior staging as part of their service. It’s usually best to outsource your home’s staging to a professional who knows the how to present a home to look its best.

7.  Consider doing upgrades or modest renovations before listing

Relatively simple upgrades can add tens of thousands to the price your home goes for. Here are examples of upgrades that can give you a high return on investment: upgrade lighting, a new coat of paint, replace shabby or scarred countertops in the kitchen and bathroom with marble or granite, replace outmoded appliances such as refrigerators, ranges or microwave ovens. Your real estate agent can suggest upgrades that are right for your specific home and neighbourhood.

8.  Understand important real estate terms and strategies

These include: holding back offers, multiple offers situations, special conditions in offers, legal terms and clauses, offer sign-backs, and irrevocable dates. Your agent can guide you through all of the important terminology and critical dates during the house selling and offer review process.

9.  Do a video tour of your home and, post it on YouTube

Be sure your agent has a copy too. Take viewers on a room-by-room tour, showcasing the home’s best features. Don’t forget to include the garden, patio and other outdoor features. Rave about the neighbourhood and neighbours; give details about nearby restaurants, shops, schools, libraries, sports facilities, parks etc. Reminisce about great times you’ve enjoyed in the home. Let viewers know this has been a happy place, and it will be missed when you’ve moved on.

10.  Commission a professional home inspection

This is especially important if you live in an older neighborhood where some of the homes may have asbestos insulation, termites, out of date pipes and wiring, etc. By having a qualified home inspector certify your home is free of these threats you can avoid having a prospective buyer commission their own inspection that may reveal issues you are not aware of. This will also speed up the selling process, as prospective buyers will not have to take the time to arrange their own inspection.

11.  Be prepared to leave an expensive appliance for the new owner

Some buyers will covet your big screen TV, a sound system, new appliances etc. These items can be great bargaining chips when negotiating a price with prospective buyers.

12.  Provide your agents with lots of access time

This is vitally important. Even if it’s sometimes inconvenient, be prepared to make your home available for prospective buyers. No one will buy without having gone through your home. If yours is unavailable when a prospective buyer wants to see it, they may buy the next home they visit.

13.  Clean and Declutter

Stash away your tchotchkes old magazines, children’s toys, hobby paraphernalia etc. Keep countertops and furniture free of clutter. Buyers are drawn to clean spaces and shiny surfaces so make sure all of the dust bunnies have been swept up and all rooms are clean and dust-free. Use furniture polish on tables and wood furniture before each home viewing. This will ensure your home looks well maintained, and the smell of wood polish will not go unnoticed.

14.  Remove personal items that may be offensive to some buyers

These includes religious items, odd collections such as shrivelled heads, skulls, animal head mounted on the wall, or posters with messages that could be considered offensive. 

15.  Put away personal items and family pictures

You want prospective buyers to envision your old house as “their new home”. Let them see there is space for their family pictures. It’s also important to keep your medications and over the counter healthcare products tucked away in your medicine cabinet or a bedside table. You don’t want prospective buys envision your home as a place of sickness.

In addition you may read more about the Selling Process here.

PB030394.jpg

REQUEST A HOME EVALUATION

I offer complimentary home evaluations. Please do not feel obliged to list and sell with me when you request your current home evaluation. I am always happy to help, and when you are ready, I will be available to provide you with my full real estate experience.

PLEASE CALL/TEXT AT 416-419-5226 OR EMAIL LUBA@LUBABELEY.COM

YOU DESERVE TRULY OUTSTANDING SERVICE!


1 Comment

May Market Report - Steady Price Growth in the GTA Housing Market

Comment

May Market Report - Steady Price Growth in the GTA Housing Market

In May, we saw a continuation of the steady price growth experienced in the Greater Toronto Area (GTA) housing market during the 4 previous months.  So far, in the first 5 months of 2018, average home prices in the GTA have increased by 9.6%, to $805,320.  Unit sales have also increased each month in 2018 - from 4,019 units in January, to 7,834 units in May.

As I mentioned in last month’s blog, the housing market conditions in 2018 are very different than the conditions experienced during the comparative period in 2017.  But beginning in May, and through the second half of 2018, the comparisons will become more meaningful, as May, 2017 was the first month last year when the impact of the foreign buyers tax began to effect a slowdown in the rate of price growth and market activity, following the frenzy in the months prior when prices were bid up to unreasonable levels due to short supply and speculation.  So for the first time, we have the impact of the foreign buyers tax in both monthly results year-over-year, which makes a May to May comparison a little more relevant.

It is interesting to note, therefore, that new listings were down by more than sales this May compared to last year, (26.2% versus 22.2%), meaning that competition heated up among buyers.  And there are indications from sellers that listing intentions are down significantly since the Fall, meaning the supply of homes available for sale could continue to be an issue in the latter half of 2018.  And when the supply of homes decreases, prices increase, as competition among buyers intensifies.

This is particularly true in the City of Toronto (416) where, for example, average selling prices were at or above average listing prices for all major home types in May.  What is even more interesting, is that the further out you travel from Downtown Toronto, the weaker the market gets.  And since the GTA housing numbers are an average over the entire 416 and 905 regions, this proves how strong the market is right now in the City of Toronto, compared to the rest of the GTA, as the following chart shows:

Screen Shot 2018-06-14 at 4.14.17 PM.png

Finally, these last two charts highlight the composition of the May sales by home type in each of the 416 and 905 sub markets.  In the 416 region, condominiums accounted for a commanding 57% of unit sales and detached homes made up 25%, while in the 905 region it was detached homes that accounted for the majority of unit sales, at 55% of the total.  What these charts clearly indicate is that condominiums are the dominant force driving unit sales in the 416 region and are in high demand compared to higher priced detached homes, while the opposite is true in the 905 region where the inventory of detached homes tends to be more prevalent and buyers have more choice, which means these homes take longer on average to sell.

If you would like to find out what these statistics mean to you, or if you are curious to know how much your property is worth today or how much you can afford to buy, please reach out. 

If you found this article helpful please hit "Like" and "Share".

Comment

Turning your single-family home into income generating property

Comment

Turning your single-family home into income generating property

Let's take a look at turning your single-family home into a two-family, income generating property. This strategy can be an attractive alternative for empty-nesters and retirees who’d prefer not to move – and who’d be happy to generate some extra income.

At some point, usually after the children have moved out, many home owners decide to downsize. Today, that usually means moving into a condo or to a smaller community.

But many couples would prefer to stay in the family home, continuing to enjoy the neighbourhood they know so well. Here’s an alternative for anyone considering their options in such a situation.

Why not re-configure your home into a two-family, income-generating property? This strategy has a number of advantages.

  • You get to stay in the home and the neighbourhood you love

  • You can avoid many of stressors involved in adapting to a new neighbourhood, new neighbours, and unfamiliar amenities and services.

  • You end up with less home to manage.

  • You can generate important extra income to help fund your retirement years and lifestyle enhancements.

  • You may significantly increase your property’s value when it’s reclassified as an income property.

Offsetting these advantages, you’ll have to deal with some challenging realties:

  • Living through the renovation process, likely four months to a year. During this period, you might have to find a temporary residence.

  • Financing the renovations.

  • Managing the renovation process to be sure it meets your expectations and stays within budget.

  • Living alongside tenants who may not share your lifestyle.

  • Assuming the role of “property manager” – this means, at a minimum, dealing with occupancy, rent collection and maintenance issues.

P6180314.jpg

Should you decide to re-configure your home to generate an income, here’s an ACTION PLAN to get the process underway.

Zoning and Permits

First, you’ll need to check out zoning issues. Is your area zoned for the living arrangement you’re hoping to create? Do you need to apply for rezoning or get a zoning restriction waiver?

Requirements vary from region to region, although there are some basics that will apply almost anywhere – each residence will need at least one exit of its own, plus bedroom, bathroom and kitchen area, and perhaps separate utilities and meters. 

Other safety standards, such as fire codes, might change once you turn the space into a two-family dwelling – such information is available from your local building planning department.

Space planning

You’ll need to consider what kind of people you want to occupy the new space – a family, students, another retired couple? This will affect the number of rooms and their sizes, the design of kitchen and bathroom spaces, and other considerations. 

If you need or want to make big changes, consult with a structural engineer. This is the time to think about major issues like the building’s envelope, and to fix any deficiencies or reconfigure the roof, walls, windows or doors.

Determine the rental income you can expect

Contact a real estate agent you trust to determine the rental income you can expect to earn, taking into consideration periods when the unit is vacant. As part of this analysis, find out how this revenue will be taxed, and what portion can be offset as expenses when you file.

Financing

You may need to take out a home improvement loan, a business loan, or even a second mortgage. Prospective lenders will need to factor in a number of elements: the use of second unit, your credit rating, etc. Ask your real estate agent to provide you with a home valuation before beginning.

Retain an architect

To be sure your re-configured property is in compliance with local zoning, building codes and safety regulations, retain an architect with local knowledge and expertise in handling this type of project. Be sure to get at least two or preferably three quotes.

Recruit a construction company

Be sure the company is experienced in this kind of project. Get at least three quotes. Have the company you select meet with the architect to work out potential issues before the construction process begins. 

Have qualified back-up in place to help keep the project on track. It’s always a good idea to have someone who cares for you to act as your back-up or to offer support as you go through the renovation process. Maybe one of your grown children, or a close friend.

Should you wish to explore this alternative to downsizing, I’d be pleased to help you assess this opportunity in respect to your specific home.

If you found this article helpful please hit "Like" and "Share".

Comment