Viewing entries in
DESIGN

Persistent supply crunch spurs price jump

Comment

Persistent supply crunch spurs price jump

Jan 2020 market stats:Luba Beley.png

TRREB President Michael Collins announced that Greater Toronto Area REALTORS® reported 4,581 home sales through TRREB’s MLS® System in January 2020 – up by 15.4 per cent compared to January 2019. On a preliminary seasonally adjusted basis, sales were up by 4.8 per cent compared to December 2019.

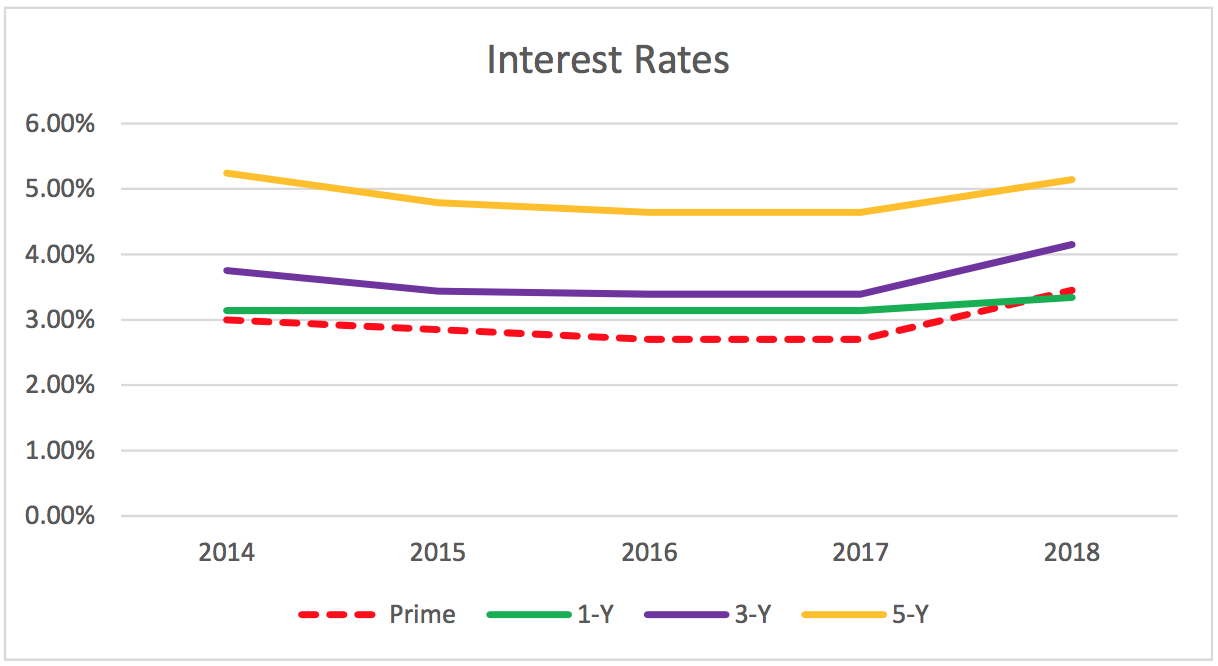
“We started 2020 where 2019 left off, with very strong growth in the number of sales up against a continued dip in the number of new and available listings. Tighter market conditions compared to a year ago resulted in much stronger growth in average selling prices. Steady population growth, low unemployment and low borrowing costs continued to underpin substantial competition between buyers in all major market segments,” said Mr. Collins.

The MLS® HPI Composite Benchmark price was up by 8.7 per cent compared to January 2019 – the highest annual rate of growth for the Benchmark since October 2017. The condominium apartment market segment continued to lead the way in terms of MLS HPI® price growth, but all home types experienced price growth above seven per cent when considering the TRREB market area as a whole. The average selling price in January was up by 12.3 per cent, driven by the detached and condominium apartment segments in the City of Toronto.

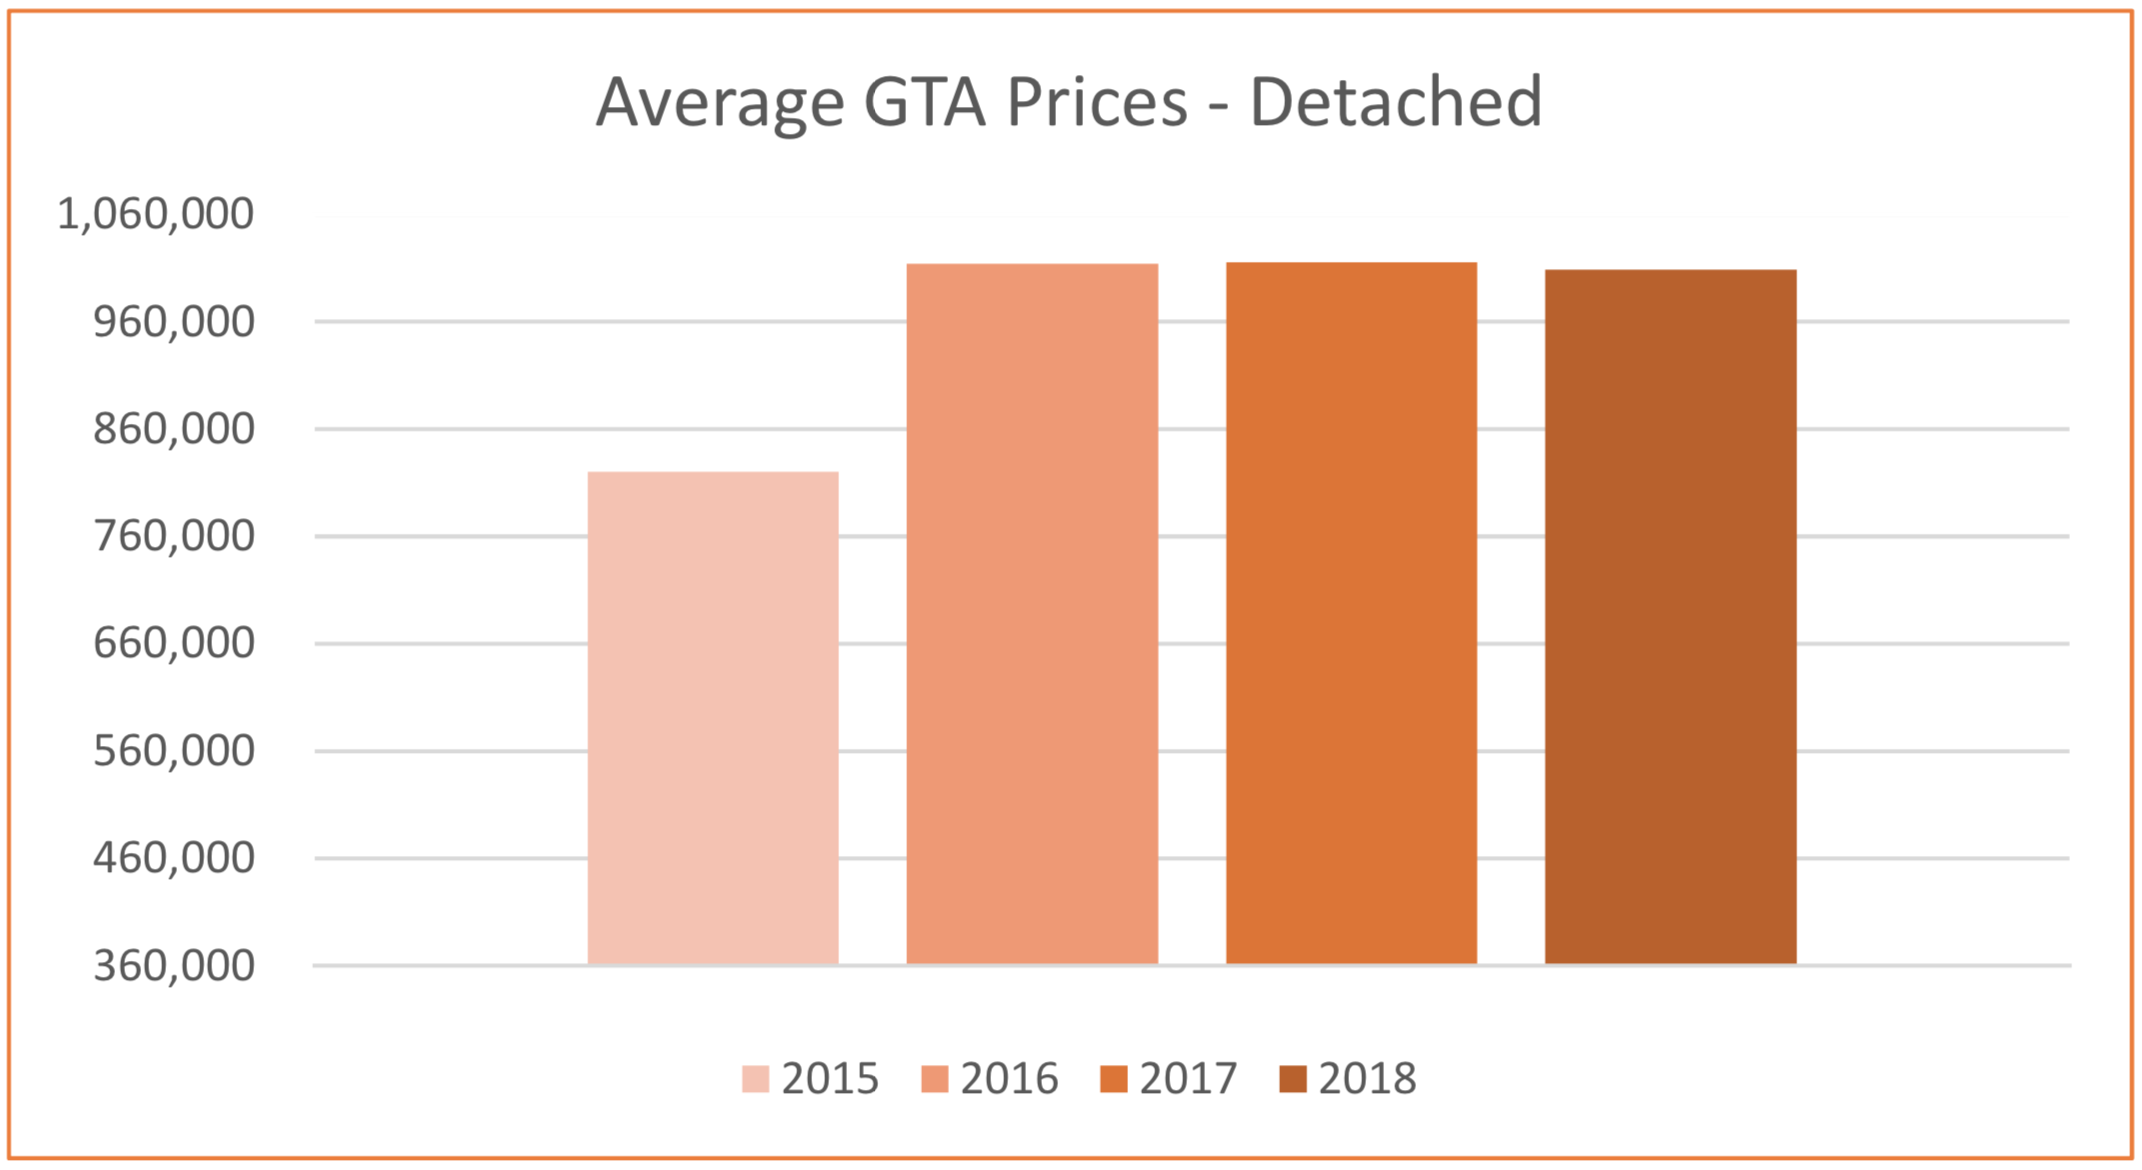
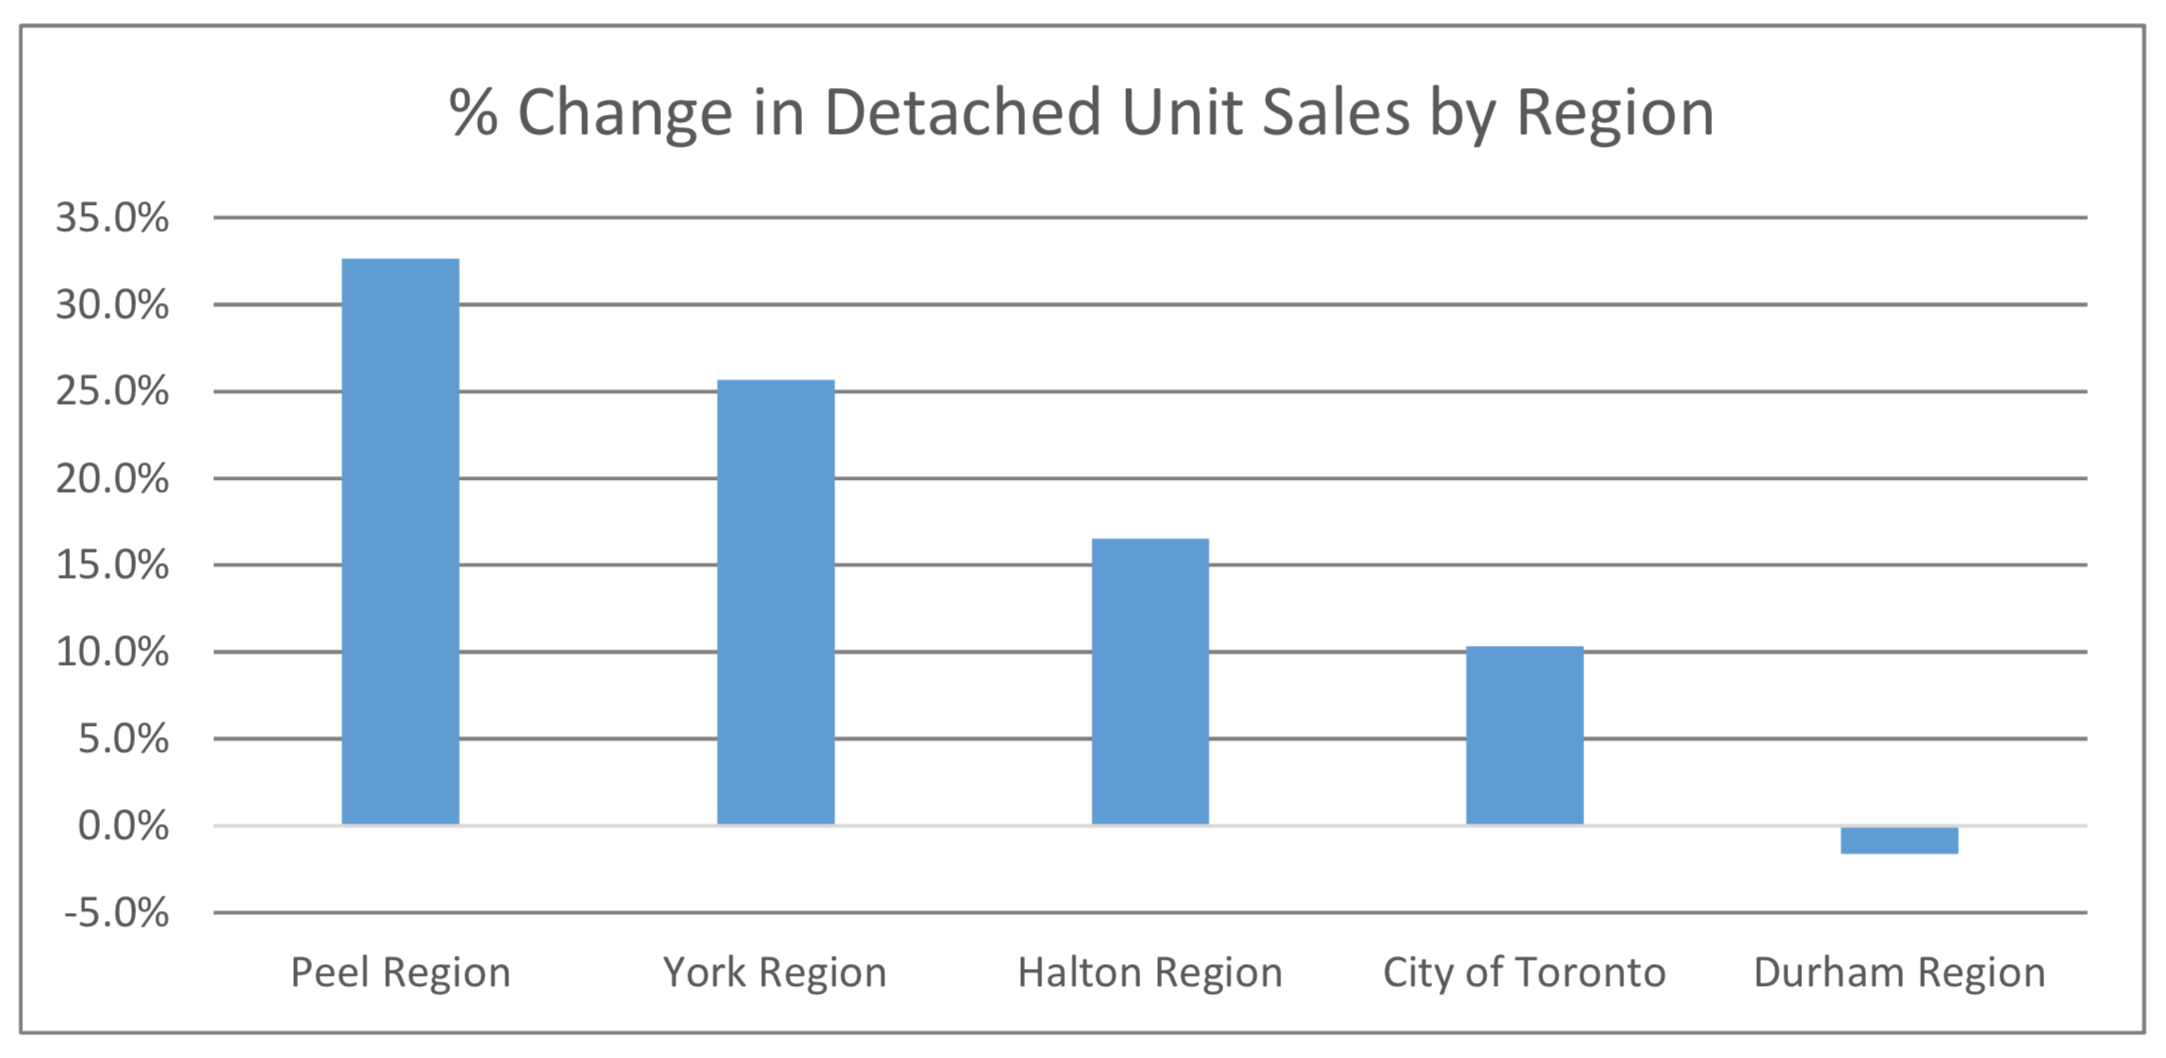
“A key difference in the price growth story in January 2020 compared to January 2019 was in the low-rise market segments, particularly with regard to detached houses. A year seems to have made a big difference. It is clear that many buyers who were on the sidelines due to the OSFI stress test are moving back into the market, driving very strong year-over-year sales growth in the detached segment. Strong sales up against a constrained supply continues to result in an accelerating rate of price growth,” said Jason Mercer, TRREB’s Director of Market Analysis and Service Channels.

If you would like to find out what these statistics mean to you, or if you are curious to know how much your property is worth today or how much you can afford to buy, please reach out. 

If you found this article helpful please hit "Like" and "Share".

*Image of Toronto - courtesy of Marco Manna.


Comment

Historic highs and lows for prices and inventory

Comment

Historic highs and lows for prices and inventory

Luba Beley Nov Market Stats.png

GTA REALTORS® Release November 2019 Stats

December 4, 2019  - Toronto Real Estate Board President Michael Collins announced that Greater Toronto Area REALTORS® reported 7,090 sales through TREB's MLS® System in November 2019 – a 14.2 per cent increase compared to November 2018. On a GTA-wide basis, sales were up year-over-year for all major market segments. Annual sales growth in ground oriented home types, including detached houses, led the way. 

New listings entered into TREB's MLS® System in November and the active listings count at the end of the month went in the opposite direction compared to last year, with new listings down 17.9 per cent year-over-year and active listings down 27.2 per cent. 

"An increasing number of home buyers impacted by demand-side policies over the past three years, including the 2017 Ontario Fair Housing Plan and the OSFI mortgage stress test, have moved back into the market for ownership housing. Based on affordability and stricter mortgage qualification standards, many buyers may have likely adjusted their preferences, changing the type and/or location of home they ultimately chose to purchase," said Mr. Collins. 

As market conditions continued to tighten in November 2019, with increased sales up against an increasingly constrained supply of listings, the annual rate of price growth continued to accelerate. The MLS® Home Price Index Composite Benchmark increased by 6.8 per cent year-over-year. The average selling price increased by 7.1 per cent year-over-year to $843,637. Both the MLS® HPI and the average selling price for the TREB market area as a whole experienced the strongest annual rates of price growth for the year in November. 

"Strong population growth in the GTA coupled with declining negotiated mortgage rates resulted in sales accounting for a greater share of listings in November and throughout the second half of 2019. Increased competition between buyers has resulted in an acceleration in price growth. Expect the rate of price growth to increase further if we see no relief on the listings supply front," said Jason Mercer, TREB's Chief Market Analyst.


If you would like to find out what these statistics mean to you, or if you are curious to know how much your property is worth today or how much you can afford to buy, please reach out. 

If you found this article helpful please hit "Like" and "Share".


Comment

More sales, less inventory, rising price growth trends continue

Comment

More sales, less inventory, rising price growth trends continue

Screen Shot 2019-11-06 at 4.19.07 PM.png

TORONTO, November 5, 2019 – Toronto Real Estate Board President Michael Collins announced that Greater Toronto Area REALTORS® reported 8,491 residential sales through TREB’s MLS® System in October 2019. This result represented a 14 per cent increase compared to 7,448 sales reported in October 2018. GTA-wide, sales were up on a year-over-year basis for all major home types.

“A strong regional economy obviously fuels population growth. All of these new households need a place to live and many have the goal of purchasing a home. The problem is that the supply of available listings is actually dropping, resulting in tighter market conditions and accelerating price growth,” said Mr. Collins.

The trend of annual growth in sales versus annual decline in new listings continued in October 2019, with new listings down by 9.6 per cent compared to October 2018. The resulting tighter market conditions compared to a year ago resulted in positive annual rates of price growth across all major market segments, from a GTA-wide perspective.

The MLS® Home Price Index Composite Benchmark was up by 5.8 per cent on a year-over-year basis in October 2019 – the strongest annual rate of growth since December 2017. The average selling price for all home types combined was up by 5.5 per cent to $852,142, compared to $807,538 in October 2018.

“As market conditions in the GTA have steadily tightened throughout 2019, we have seen an acceleration in the annual rate of price growth. While the current pace of price growth remains moderate, we will likely see stronger price growth moving forward if sales growth continues to outpace listings growth, leading to more competition between home buyers,” said Jason Mercer, TREB’s Chief Market Analyst.

If you would like to find out what these statistics mean to you, or if you are curious to know how much your property is worth today or how much you can afford to buy, please reach out. 

If you found this article helpful please hit "Like" and "Share".


Comment

2019 August Sales Up, Active Listings Drop

Comment

2019 August Sales Up, Active Listings Drop

Screen Shot 2019-09-06 at 10.41.03 AM.png

7,711 home sales were reported through the Toronto Real Estate Board MLS in August 2019, representing a 13.4 per cent increase over August’s 2018 results.

Detached home sales in the 905 area showed the most significant increase of all property types with a 24.5 per cent rise year-over-year.

The federal government’s First-Time Home Buyer Incentive (FTHBI) that came into effect on September 2 may add further momentum, as the 905 area is anticipated to be a more likely beneficiary of the program than the 416 area.

Total Active Listings continue to be an important part of the story with a drop of available inventory across the board of 11.16 per cent from last year. The 416 area had under 30 per cent of the 15,870 Active Listings reported by TREB for August, indicating that the 905 is heating up faster than the City.

If you would like to find out what these statistics mean to you, or if you are curious to know how much your property is worth today or how much you can afford to buy, please reach out. 

If you found this article helpful please hit "Like" and "Share".

Comment

Competition between buyers, low inventory, keep market tight

Comment

Competition between buyers, low inventory, keep market tight

lubabeley.com march market stats.png

March 2019 activity was the softest in 10 years in the GTA but relative to February, resales increased to just under 2% month-over-month (on a preliminary seasonally-adjusted basis). A lack of buying options continue to be a factor holding back activity as the number of new listings fell 4.5% from a year ago.

Robert Hogue, Senior Economist with RBC, says this explanation finds some support in the fact that the benchmark price rose at a faster pace in March (2.6% year-over-year) than February (2.3%)—suggesting that buyers had to bid more aggressively in the face of limited supply.  While market-cooling government policy continues to dampen consumer confidence, the advent of warmer weather after a particularly harsh winter in the GTA will hopefully bring a welcomed boost to spring market activity.

If you would like to find out what these statistics mean to you, or if you are curious to know how much your property is worth today or how much you can afford to buy, please reach out. 

If you found this article helpful please hit "Like" and "Share".


Comment

Tighter market driving price growth

1 Comment

Tighter market driving price growth

Screen Shot 2019-03-06 at 3.50.05 PM.png

5,025 home sales were reported through the Toronto Real Estate Board MLS in February 2019, down by 2.4 per cent compared to February 2018.

The average selling price for all home types combined was up by 1.6 per cent over the same period.

The semi-detached segment was the best performer, with average prices rising 9.9 per cent on the year and condos continue to trend as a positive driver of year-over-year price growth. A decline of 6.2 per cent for new listings from a year earlier, however, is a concerning statistic that industry analysts suggest is being driven by the OSFI mortgage rules that are keeping buyers on the sidelines.

“The OSFI mandated mortgage stress test has left some buyers on the sidelines who have struggled to qualify for the type of home they want to buy. The stress test should be reviewed and consideration should be given to bringing back 30 year amortizations for federally insured mortgages. There is a federal budget and election on the horizon. It will be interesting to see what policy measures are announced to help with home ownership affordability,” said Mr. Bhaura, President of the Toronto Real Estate Board.

“Home sales reported through TREB’s MLS® System have a substantial impact on the Canadian economy. A study conducted by Altus for TREB found that, on average, each home sale reported through TREB resulted in $68,000 in spin-off expenditures accruing to the economy. With sales substantially lower than the 2016 record peak over the last two years, we have experienced a hit to the economy in the billions of dollars, in the GTA alone. This hit has also translated into lower government revenues and, if sustained, could impact the employment picture as well,” said Jason Mercer, TREB’s Director of Market Analysis and Service Channels.

If you would like to find out what these statistics mean to you, or if you are curious to know how much your property is worth today or how much you can afford to buy, please reach out. 

If you found this article helpful please hit "Like" and "Share".


1 Comment

New Looks for Cabinets and Countertops Emerging in 2019

Comment

New Looks for Cabinets and Countertops Emerging in 2019

New products and styles for cabinets and countertops were on display at the Kitchen & Bath Industry Show, the industry’s biggest event, held in Las Vegas from February 19 to 21, 2019.

Dark colors, wood patterns and thin surfaces are a few of the trends inspired by natural and industrial materials.

Screen Shot 2019-03-05 at 4.23.31 PM.jpg
Screen Shot 2019-03-05 at 4.23.55 PM.jpg

Wood-look patterns have been trending on flooring and wall applications for some time, but it’s new to see them on countertops. Clairidge, shown in this photo, is Cambria’s first wood-look design. It features tan, walnut brown, cream, black and gray in undulating parallel layers that mimic the look of wood grain. The Woodstone collection is inspired by the tones and movement of various wood grains. 

Screen Shot 2019-03-05 at 4.24.29 PM.jpg

Engineered Counters Take On Navy 

Multiple manufacturers displayed navy or navy-flecked counters, which marry well with still-trending deep blue cabinets; navy is especially popular as an island-base or lower-cabinetry color. This photo shows Cambria’s new Islington design, which has dramatic navy and other blue tones interspersed with grays and whites. It’s also part of Cambria’s new Black Marble collection.

New Technology Allows for Thinner Engineered Surfaces

Wilsonart introduced ultra-thin countertops in a range of designs: stone and quartz looks as well as wood-look and steel patterns. The European-inspired ultrathin surfaces are one-half-inch thick and can be installed with an undermount sink. The material is a new composite made of resins and paper. 

Screen Shot 2019-03-05 at 4.25.20 PM.jpg


Cosentino also introduced a thin surface with a 4-millimeter-thick version of its Dekton product, an engineered material made of glass, quartz and porcelain known for outdoor uses due to its durability and resistance to fading.

Thanks to its new thinner profile, the product can be used on cabinetry doors and drawers, backsplashes and wall cladding in kitchens and baths, as well as on furniture, and Cosentino is hoping designers will start incorporating the product more indoors. Dekton Slim is available in nine colors. 

This material is curtesy of houzz.com. Continue on reading here. Main blog photo credit of juniper-design.com.


Comment

Moderate year-over-year price increases, record square footage cost for pre-construction condos

Comment

Moderate year-over-year price increases, record square footage cost for pre-construction condos

January 2019 Market Report

4,009 home sales were reported through the Toronto Real Estate Board MLS in January 2019, up by 0.6 per cent compared to January 2018. The average selling price was up by 1.7 per cent for the month year-over-year.

The first month of this year continues to show the condo market segment leading the way in terms of price growth. This segment is one to watch closely, as data released on February 1, 2019 by Urbanation Inc., which tracks data in the pre-construction condo market in the GTA, indicate that prices of pre-build condo units rose 16 per cent in 2018 to a record of $921 a square foot in the GTA over all, and $1,117 a square foot in central Toronto. Over the past two years, new construction condos prices have climbed by 56 per cent in the GTA, far outpacing price increases for resale condos.

Here you can see the real estate market behaviour for the last 5 years 2014 - 2018.

Here you can see the real estate market behaviour for the last 5 years 2014 - 2018.

January 2019 unit sales and inventories look very similar to Jan 2018

January 2019 unit sales and inventories look very similar to Jan 2018

Screen Shot 2019-02-10 at 8.38.23 PM.png
Months of Inventory is currently at 3 months, exactly how it was a year ago. We are still experiencing a seller’s market.

Months of Inventory is currently at 3 months, exactly how it was a year ago. We are still experiencing a seller’s market.

As you can see, Months of Inventory for Detached sector is a bit higher than it is for the Semi-Detached or Condominium properties due to affordability factor.

As you can see, Months of Inventory for Detached sector is a bit higher than it is for the Semi-Detached or Condominium properties due to affordability factor.

Months of Inventory for regions 416 & 905 in all categories.

Months of Inventory for regions 416 & 905 in all categories.

If you would like to find out what these statistics mean to you, or if you are curious to know how much your property is worth today or how much you can afford to buy, please reach out. 

If you found this article helpful please hit "Like" and "Share".


Comment

Mortgage stress test and low inventory influence November 2018 market activity

1 Comment

Mortgage stress test and low inventory influence November 2018 market activity

Screen Shot 2018-12-18 at 5.08.16 PM.png

November 2018 saw a 14.7 per cent drop in sales compared to November of 2017. Lower sales activity for the month year over year was anticipated as the looming imposition of new mortgage stress-test in January 2018 fueled a spike in sales activity at the end of 2017 from buyers wanting avoid the tougher rules. 

With the number of active listings down by 9.8 per cent year over year and a drop of 26.1 per cent in new listings for the period, lack of inventory continues be a key market influencer, pushing home prices up by 3.5%.

Sale prices for semi-detached properties improved the most, although lower-priced housing options such as condos and townhouses continued to show steady increases as influenced by the mortgage stress test restrictions and higher borrowing costs.

If you would like to find out what these statistics mean to you, or if you are curious to know how much your property is worth today or how much you can afford to buy, please reach out. 

If you found this article helpful please hit "Like" and "Share".


1 Comment

GTA Housing Market Conditions Tightened Further in October

1 Comment

GTA Housing Market Conditions Tightened Further in October

Luba+Beley+October+Market+Report.png

The Toronto Real Estate Board released results for October 2018, reporting tightening conditions in the GTA with sales up and new listings down.

Housing sales across the GTA rose last month compared to a year ago. Prices also rose, helped by strong sales in the condo market. The overall average selling price for all housing types in the GTA was $807,340, up 3.5% year over year. Condos were the housing type that experienced the greatest price growth with a 7.5% increase. 

A total of 7,492 sales of all housing types were reported throughout the MLS system in October, which is 6% higher than the same month last year. Condos further drove the October market in unit sales, where 1,519 condo units were sold in the 416 area in October, a result that was greater than the total number of units sold of all other housing types combined in the 416.  It was a very different story in the 905 regions of the GTA where combined sales of 3,771 detached, semi-detached and townhome units in the month outpaced condo units sold by over 6 to 1.


“Annual sales growth has outstripped annual growth in new listings for the last five months, underpinning the fact that listings supply remains an issue in the Greater Toronto Area” noted TREB’s Director of Market Analysis, Jason Mercer, and as seen in the graphic below.

Luba Beley Market Watch Oct 2018

If you would like to find out what these statistics mean to you, or if you are curious to know how much your property is worth today or how much you can afford to buy, please reach out. 

If you found this article helpful please hit "Like" and "Share".


1 Comment

Annual Price Growth Stronger in Higher Density Home Types

Comment

Annual Price Growth Stronger in Higher Density Home Types

The rate of increase in Toronto home prices continues to outpace that of the 905 regions, particularly in the higher density home types.  The price of a detached home in Toronto was roughly 50% higher than in the suburbs on average in September.  Two years ago the price of a detached home in the City was approximately 40% higher than one in the suburbs.  Compare that with condo prices in the City, which two years ago were about 20% more expensive than in the suburbs, but in September, 2018 are now almost 35% more expensive, as seen in the chart below.  The average price of the 6,455 homes sold in the GTA in September was $796,786, 2.9% higher than the average of $774,489 a year earlier when 6,334 units were sold in the GTA.

Screen Shot 2018-10-05 at 8.59.42 AM.png

The more affordable home types including condominiums, townhouses and semi-detached homes all saw strong price growth in September, compared to the prior year.  In contrast, the average price of a detached home in the GTA was relatively flat compared to 2017.  The average price of a detached home in the City of Toronto, where approximately 23% of total GTA detached home sales occurred, was down by 1.4%, compared to the suburbs, where the average price was 0.6% less than a year earlier.  The average selling price for a detached home in Toronto in September was $1,342,363, compared to the average suburban selling price of $905,722.

Screen Shot 2018-10-05 at 9.02.30 AM.png

In the City of Toronto, where slightly more than 70% of total GTA condominium sales occurred in September, the Toronto Real Estate Board (TREB) reported 1,282 condominium unit sales. The average price of a condominium in Toronto rose by 11.7% in September year-over-year, almost twice the rate of increase in the price of the average condominium in the 905 regions, where prices rose by 6.4%. The average selling price for condominium in Toronto in September was $615,582, compared to the average suburban selling price of $455,686.

Screen Shot 2018-10-05 at 9.03.52 AM.png

This final chart shows how Toronto has continued to dominate the share of the total GTA condominium sales in September for the past three years.  Now more millennials and Gen Z (those born between the early 1980s and early 2000s) are entering the housing market.  For them, a condo lifestyle is both preferred and affordable.  Condos also remain in high demand among retiring boomers, particularly those who are downsizing and wish to remain in an urban setting in a large metropolitan City such as Toronto.

Screen Shot 2018-10-05 at 9.05.05 AM.png

If you would like to find out what these statistics mean to you, or if you are curious to know how much your property is worth today or how much you can afford to buy, please reach out. 

If you found this article helpful please hit "Like" and "Share".


Comment

GTA Housing Sales and Price Growth Continues in August

Comment

GTA Housing Sales and Price Growth Continues in August

Greater Toronto Area housing sales of 6,939 units increased by 8.5% in August, 2018, compared to August, 2017 when 6,306 unit sales were recorded.  The average price of a home in the GTA also rose by 4.7% year over year and now stands at $765,270, compared to $730,969 in August 2017.  Month-over-month sales and price growth also continued in August and the annual rate of sales growth outpaced the annual rate of new listings growth.

Detached home sales were up by over 16% on a year-over-year basis in August, substantially more than the 1.6% increase in the other less-expensive semi-detached, townhome and condominium segments of the market.

Screen Shot 2018-09-09 at 11.17.56 AM.png

The 905 Regions surrounding the City fuelled most of this growth in detached unit sales, particularly in the Peel and York Regions, which recorded increases in detached unit sales of 32.6%, and 25.7%, respectively, as seen in the chart below.  In the City of Toronto (416) detached unit sales increased by 10.3%.

Screen Shot 2018-09-09 at 11.18.46 AM.png

Conversely, the City of Toronto is where average sales prices increased the most, at 8.1% year-over-year.  Prices also rose by 7.6% in Peel Region, while other areas of the GTA mostly experienced a percentage decrease in average selling prices.

There is now only slightly more than  2 ½ months inventory in the GTA as a whole and less than 2 months of inventory in the City of Toronto.  Many GTA neighbourhoods continue to suffer from a lack of inventory, although this is more pronounced in the City of Toronto.  York Region (north of the City) continues to have the largest supply of homes available for sale at 4.3 months supply, while in Halton, Peel and Durham (the regions northwest, west and east of the City, respectively), inventories are only slightly higher than in the City, at 2.3 to 2.4 months supply.

Screen Shot 2018-09-09 at 11.21.15 AM.png

Ownership of a home remains a solid long-term investment in the GTA, a region where the economy remains strong and the population continues to grow.

If you would like to find out what these statistics mean to you, or if you are curious to know how much your property is worth today or how much you can afford to buy, please reach out. 

If you found this article helpful please hit "Like" and "Share".


Comment

GTA Housing Statistics Turn the Corner in June

2 Comments

GTA Housing Statistics Turn the Corner in June

Home sales in the Greater Toronto Area (GTA) were 2.4% higher in June 2018 than they were in June 2017, and the average selling price edged up on a year over year basis by 2%.  This is the first time since 2016 that unit sales increased year over year and now reverses the year on year trend of declining monthly unit sales seen every month since April 2016.   And new listings dropped from those recorded in June of last year by 18.6%, meaning that market conditions appear to be tightening, signalling that the housing market has turned the corner to a more positive course, as sales accounted for a 10.4% greater share of listings, up from 40.4% of active listings in June 2017 to 50.8% in June 2018.

Screen Shot 2018-07-05 at 3.30.43 PM.png
Screen Shot 2018-07-05 at 3.32.25 PM.png

There was also a change in the mix of properties sold in June 2018 compared to June 2017, with low-rise home types accounting for a greater share of sales at 63.2% this year compared to 61.0% last June.  Sales of Detached and Semi-Detached homes were up by 5.5% and 8.1%, respectively, year-over-year in June, while condominium unit sales decreased by 5.3% in the same period.

All of this is happening as a result of that fact that home buyers are starting to move back into the market, after adjusting to the regulatory impacts of the foreign buyers tax which took effect in April last year, and the generally higher borrowing costs and new mortgage qualification stress tests that followed.  The expectation is that we will see continued improvement in sales over the next year, although it is likely that issues related to the supply of listings will persist, leading to increased upward pressure on home prices as competition among buyers intensifies.

Finally, it is interesting to note that unit sales and selling prices were up in each and every month in 2018, reversing the trend that started in April of last year when the impact of the foreign buyers tax negatively impacted both numbers until housing activity rebounded somewhat in the fourth quarter, when buyers rushed to secure home ownership prior to the new stress tests coming into effect in January of 2018.   As the chart below also demonstrates, home ownership has proven to be a positive long-term investment.

Screen Shot 2018-07-05 at 3.33.22 PM.png

If you would like to find out what these statistics mean to you, or if you are curious to know how much your property is worth today or how much you can afford to buy, please reach out. 

If you found this article helpful please hit "Like" and "Share".


2 Comments

Kitchen renovation has greatest potential to boost a property’s sale price

Comment

Kitchen renovation has greatest potential to boost a property’s sale price

TORONTO, JUNE 28, 2018 – According to a cross-Canada survey of over 750 Royal LePage real estate experts, a kitchen renovation is the clear upgrade of choice with the potential to boost a property’s value by more than 12.5 per cent.[1] Both ranking second, a finished basement or a new bathroom has the potential to increase a property’s value between 2.5 per cent and 12.5 per cent, depending on the investment.

“To financially benefit from a home improvement project, you need to keep potential homebuyers in mind,” said Tom Storey, real estate agent, Royal LePage Signature Realty. “While updating a kitchen should increase your sale price, a pool can actually deter families with young children or those who are looking for less maintenance.”

Adding a pool or deck is considered the least worthwhile renovation to increase a property’s value with pricing potential limited to a maximum of 2.5 per cent of the value of the home.

For Canadians looking for more general guidance on where to focus their home projects, the vast majority of surveyed experts recommended interior renovations (95.0%) over exterior renovations (5.0%).

“Curb appeal is important but more time is spent indoors at the open house and that is where buyers typically fall in love with a home,” added Storey. “When renovating with the potential to sell, the most important thing to remember is to use colours and materials that are popular and not too personal.”

The survey showed that prospective sellers are willing to invest less than 2.5 per cent of a property’s value on home renovations prior to listing their home, which represents an investment of up to $15,138 on a property valued at $605,512[2] – the current median home price in Canada.

When asked which generation is the most likely to renovate their home, 45.1 per cent of surveyed experts said baby boomers, as many are planning to sell and downsize. They are also most likely to have the funds needed for a significant renovation.

“Baby boomers run the risk of their property selling for a lower price or languishing on the market for longer than expected if they held their property for a long period of time without updating periodically,” said Storey. “Although many buyers can see themselves making home improvements themselves, its very hard for a buyer to get excited or imagine living in a space that is run down or the decor reflects another generation.”

Popular Home Improvements

About the home renovations ROI survey.

The Royal LePage Home Improvement Survey polled 766 real estate advisors from across Canada, between June 20, 2018 and June 25, 2018. Each respondent was asked to complete an online survey composed of 8 questions on the value of popular home improvements.

[1] Statistic referenced in table Popular Home Improvements

[2] National Home Price Aggregate, Royal LePage House Price Composite, Q1 2018.

This article is curtesy of www.royallepage.ca.

I offer complimentary home evaluations. Please do not feel obliged to list and sell with me when you request your current home evaluation. I am always happy to help, and when you are ready, I will be available to provide you with my full real estate experience.

Request your home evaluation:

PLEASE CALL/TEXT AT 416-419-5226 OR EMAIL LUBA@LUBABELEY.COM

Comment

April Market Report  |  Which Headline Tells the True Story?

Comment

April Market Report | Which Headline Tells the True Story?

Average Selling Price for Homes in the GTA up 9.2% Year to Date, OR

Average Selling Price for Homes in the GTA down 12.4% in April Year-Over-Year?

Well, both are true actually.  But which one is more relevant?

I believe the first headline is more relevant, because it tells us what is happening in the current real estate market.  We already know that the GTA real estate market reset from its historical highs (in April, 2017 the GTA recorded the highest ever average selling price) after the introduction last year of the foreign buyers tax in Q2, followed by the more restrictive mortgage qualification rules introduced at the beginning of 2018.  Add to those measures the 2 successive increases in interest rates by the Bank of Canada and the market cooled down considerably.

Headlines are meant to grab the reader’s attention.  And one could argue that negative headlines tend to attract more attention than positive ones.  But the facts are that the GTA real estate market is trending positive, despite being off its historical highs.  Take a look at these statistics for the first 4 months of 2018:

Screen Shot 2018-05-08 at 2.03.08 PM.png

Unit Sales and Active Listings have increased in each month.  Average selling price is up 9.2% in four months.  Days on the Market have gone down by more than a third, and Average Selling Price to List Price is stable.  These are all signs of a healthy real estate market.

But the GTA real estate market is really a tale of 2 cities.  As reported by TREB in their latest Market Watch:

“The year-over-year change in the overall average selling price has been impacted by both changes in market conditions as well as changes in the type and price point of homes being purchased.  This is especially clear at the higher end of the market.  Detached home sales for $2 million or more accounted for 5.5% of total detached sales in April 2018, versus 10 per cent in April 2017.”

The differences in the composition of the current GTA real estate market can seen by looking at the following statistics broken down by major home type:

Screen Shot 2018-05-08 at 2.02.42 PM.png

There is roughly a 3 month supply of detached homes for sale in the GTA, whereas there is only a 1 ½ month supply of condominium units for sale. As well,  the increase in Average Selling Price for Condominiums, at 10.2% for the first four months of 2018, is outpacing the rate of increase for Detached homes, at 6.1%, as there is obvious pressure at the lower end with Condominiums in short supply.  TREB expects that “once we are past the current policy-based volatility, home owners should expect to see the resumption of a moderate and sustained pace of price growth in line with a strong local economy and steady population growth”.

If you would like to find out what these statistics mean to you, or if you are curious to know how much your property is worth today or how much you can afford to buy, please reach out.

If you found this article helpful please hit "Like" and "Share".

Comment

What’s the difference between an Agent, Salesperson, Broker and a REALTOR®?

Comment

What’s the difference between an Agent, Salesperson, Broker and a REALTOR®?

You’ve heard many terms when referring to people who sell real estate. What’s the difference between an Agent, Salesperson, Broker and a REALTOR®?

Yes, the terminology can be confusing. While it may not seem important to know the difference between these terms, there are some common traits and useful distinctions to be aware of when you look to buy or sell a home.

Let’s start with the most commonly misused term, “agent”. While most people would use that term to describe the individual real estate professional assisting them, that’s not technically correct; legally, “Agent” is actually the term given to the brokerage (the company) that represents you as the buyer or seller. An agency relationship is formalized when you sign a contract either in the form of a buyer representation agreement or a typical listing agreement. These are between buyer/seller and the brokerage, not the individual representative.

A real estate salesperson or broker will be the person who presents and explains the representation agreement to you on behalf of the brokerage. In most cases, they will also usually be the same person who represents you during the buying or selling process, on behalf of the brokerage.

Salespeople and brokers are both real estate professionals who are subject to regulation under the Real Estate and Business Brokers Act, 2002. They must be employed by a real estate brokerage and must be registered with RECO (Real Estate Counsel of Ontario) in order to trade in real estate in Ontario. More info at RECO.on.ca

Education is what distinguishes a broker from a salesperson. A salesperson achieves the broker designation by successfully completing the Broker Registration Education Program. This course will provides an overview of how to establish, operate, and manage a real estate brokerage. More info at OREA.com

What's the definition of a REALTOR®? REALTOR®, REALTORS® and the REALTOR® logo are certification marks owned by REALTOR® Canada Inc., a corporation jointly owned by the National Association of REALTORS® and CREA.

Not all real estate agents are REALTORS®.

The REALTOR® trademarks are used to identify real estate services provided by brokers and salespersons who are members of CREA and who accept and respect a strict Code of Ethics, and are required to meet consistent professional standards of business practice which is the consumer’s assurance of integrity. More info at CREA.ca

If you found this article helpful, please hit "Like" and "Share"! 

Comment

How do the Month of February Results Compare to the Long-term Trends in the GTA Housing Market?

Comment

How do the Month of February Results Compare to the Long-term Trends in the GTA Housing Market?

The Toronto Real Estate Board (TREB) released its February Stats on March 6, announcing that Greater Toronto Area REALTORS® reported 5175 residential transactions through TREB’s MLS® System in February 2018.  This result was down by 34.9% compared to a record 7,955 sales reported in February, 2017.  The overall selling price fell by 12.4% year-over-year to $767,818 from $876,336.  But remember, prices spiked in the first quarter of 2017.  If you put that aside and compare this result to February 2016, you will note that prices in February 2018 remained 12% higher than the average reported for February 2016, and that represents an annualized increase which is well above the inflation rate for the past 2 years.

Active listings increased by 147.4%, from 5,400 a year earlier to 13,362 in February 2018, accounting for an increase in inventory levels to roughly 2.6 months of supply in 2018, from the unhealthy 0.7 ratio seen last February.

Last month I presented some charts showing what was going on in the market on a micro basis, compared to the past 5 years.  This month, I’m digging deeper, going back 10 years, but on a more macro level.  The solid horizontal line in each of the following charts shows the 10-year average value for the metric being measured.  And, except unit sales for the month of February 2018, which were off significantly from their 10-year average, the charts present a pretty clear picture that February 2018 produced results that were very close to historical averages for that month.

Screen Shot 2018-03-09 at 7.06.36 PM.png

In fact, average overall prices in February, 2018 were just slightly off their 10-year trend average growth rate (green line below), mostly because the abnormally high run-up in prices in 2017 that was caused by demand-supply imbalances, (particularly in single family detached homes) pushed the trend line upwards.  Another interesting observation is that although February 2018 prices on average were down by 12.4% when compared to February 2017, condominium prices (the blue column in the chart below) continued their upward trend, increasing by another 10.1% over their February 2017 record level.  And condominium prices are now trending above their 10-year average growth (blue line below).

Luba Beley Market Report

This next chart shows that the market is a more balanced one in February 2018 than it was in either February 2016 (when inventory of homes for sale was extremely low at just over 1.5 months of supply) or February 2017 (when inventory was almost non-existent).  Inventory compared favourably in February 2018, at 2.6 MOI, to the historical average of 2.4 months of supply.

Screen Shot 2018-03-09 at 7.05.09 PM.png

Lastly, a comment on interest rates – the Bank of Canada decided not to increase its benchmark interest rate this month from its current level of 1.25%, adopting a cautiously negative tone about the growing uncertainty for the global and Canadian outlooks as a result of the U.S. trade policy which is edging towards more protectionism and higher tariffs.  Home buyers can breathe a sigh of relief (however brief) that interest rates will likely remain at their current levels for at least another quarter.

If you are curious to know how much your property is worth today or how much you can afford to buy, please feel free to reach out; and if you found this article helpful please hit "Like" and "Share".

Comment

March Market Report - Pictures Say It All

March Market Report - Pictures Say It All

The market has returned to a more balanced one, reflecting the same characteristics as it did back in January 2014 and here is why.

The Toronto Real Estate Board (TREB) released its January Stats on February 6, announcing that Greater Toronto Area REALTORS® reported 4,019 residential transactions through TREB’s MLS® System in January 2018.  This result was down by 22% compared to a record 5,155 sales reported in January, 2017.  The overall selling price fell by 4.1% year-over-year to $736,783 from $768,351, with the decline being weighted toward the detached segment of the market, continuing the trend seen in the latter half of 2017.  Active listings increased by 136.3%, from 5,034 a year earlier to 11,894 in January 2018, accounting for an increase in inventory levels to roughly 3.0 months of supply in 2018, from the unhealthy 1.0 ratio seen last January.

Now I want to show you some pictures that put these statistics into historical perspective.  And the results may surprise!  January home sales increased by roughly 1,000 units from 4,103 units in 2014 to 5,155 units in 2017, then decreased in 2018 back to the 2014 level.  What is interesting, however, is that the mix of sales by major home type during the 4-year period saw the share of condominiums as a percent of total unit sales rise by 5.4%, from 26.7% of the total in 2014 to 32.1% in 2018, while the share of higher priced detached and semi-detached homes decreased by 5.4%, from 46.2% of the total to 41.8%.  The shift was most dramatic from 2017 to 2018, as affordability became a major issue, particularly for first time home buyers who have flooded the condominium market.

Screen Shot 2018-02-08 at 10.25.29 AM.png

After a period of declining interest rates, it appears that the recent Bank of Canada increases are setting the stage for further interest rate increases on the horizon.  But interest rates today are essentially the same as they were in January 2014.

Interest rates Luba Beley

The market has surely returned to a more balanced one, reflecting the same characteristics as it did back in January 2014, when the inventory of homes (MOI) stood at roughly 3 months of supply, indicating that on average a home took 3 months to sell in 2014, exactly the same amount of time as it would in 2018, but a far cry from January 2017 when the inventory of homes was at an historically low of 1 month supply.

Year-Over-Year Summary/ Luba Beley

Lastly, although prices were down on average by 4.1% year-over-year this January, they are still up a cumulative 49.3% - from $526,965 in 2014 to $736,783 in 2018 - for the average home sold in the GTA.  Interestingly, the average annual price increase for detached homes in the 4-year period was 9.0% per year, compared to the average annual price increase for condominiums of 10.0% per year, but with lower priced condominiums making up a larger share of the total unit sales in 2018 than they did in 2014, this brought the overall annual increase in prices down to 8.7% per year on average for all housing types during the 4-year period.

Average price by major home type/ Luba Beley

If you are curious to know how much your property is worth today or how much you can afford to buy, please feel free to reach out; and if you found this article helpful please hit "Like" and "Share".


Gold Leaf Prints of the Human Brain by Greg Dunn

Comment

Gold Leaf Prints of the Human Brain by Greg Dunn

TRULY REMARKABLE ART FORM - DIVING DEEP INTO YOUR BRAIN

“Self Reflected” by American artist/neuroscientist Greg Dunn and Dr Brian Edwards is a stunning series of gold leaf prints of the human brain. Bringing new perspective to the mind, the work bridges the connection between the macroscopic brain and the behavior of neurons through a revolutionary technique called reflective microetching. Gilded with 1,750 sheets of gold leaf, slices of the brain are magnified and the natural flow of neural activity revealed in the play of light across the rich and elaborate surface. Made with a combination of hand drawing, neuroscience data, algorithmic simulation of neural circuitry and photolithography, the project represent a seamless and unique marriage of art and science.

Greg elaborates on the method and motive behind this project:

“Self Reflected animates brain activity with light reflecting off of a golden surface and offers an unprecedented insight of the brain into itself. It reveals an enormous scope of neural choreography occurring in our own minds at the very moment of observation. It was created to remind us that the most marvelous machine in the known universe is at the core of our being. It is the root of our shared humanity.”


For more info please visit: www.gregadunn.comwww.brian-edwards.com


Comment

Thomas Jackson’s Emergent Behavior

Comment

Thomas Jackson’s Emergent Behavior

Thomas Jackson’s interest in photography emerged from street scenes and has evolved to more conceptual elements. Jackson’s work, which includes photo and installation, often combines elements inspired by self-organizing, “emergent” systems in nature such as termite mounds, swarming locusts, schooling fish and flocking birds. The images attempt to tap the mixture of fear and fascination that those phenomena tend to evoke, while creating an uneasy interplay between the natural and the manufactured and the real and the imaginary. Course:  http://trendland.com/thomas-jacksons-emergent-behavior-1/


Comment