Viewing entries in
REAL ESTATE

More Signs that Toronto Area Real Estate Market is in Recovery Mode

1 Comment

More Signs that Toronto Area Real Estate Market is in Recovery Mode

Year-over-year resale home prices and sales rose for a second consecutive month in July, signalling that the Toronto area real estate market is in recovery mode.

Average selling prices climbed 4.8% to $782,129 last month, up from $745,971 in the same period last year and the number of homes sold rose 18.6% to 6,961 units, compared to 5,869 homes sold in July, 2017.

Condominiums continued to outperform low rise housing such as detached, semi-detached and townhomes.  On average last month condo prices rose 8.9% across the GTA to $546,984.  What is interesting to note, however, is that even though roughly 70% of the condos sold last month were in the City of Toronto (416), the rate of price appreciation has been shifting in favor of the suburban markets (905), where prices were up by 10.3%  in July, compared to 9.2% for the City of Toronto.  This is a dramatic shift from the month of June, when condominium prices in Toronto rose by more than 9% while the suburban markets only posted price appreciation of less than 4%. A condominium in Toronto cost $582,547 on average, compared to $461,255 in the surrounding regions.

Screen Shot 2018-08-06 at 1.38.55 PM.png

Year-over-year prices for detached homes, rose by 0.5% on average in July to $1,004,647, but the scarcity of detached homes listed for sale in Toronto helped boost prices by 3.6% inside the City, while prices remained flat in the surrounding 905 communities where roughly 3/4 of all the detached home sales were recorded.  A detached house in Toronto cost $1,350,700 on average, compared to $907,347 in the surrounding regions.

Screen Shot 2018-08-06 at 1.39.09 PM.png

Months of inventory across all home types in the GTA stood at roughly 2.8 months supply in July compared to 2.4 months supply a year earlier, but the numbers look very different when viewed by housing type and location.  As seen in the chart below, months of inventory of detached homes are roughly double that of any other housing type, and this is even more pronounced when one compares Toronto to the surrounding regions where inventories across all housing types are generally about one month higher than in the City.

Screen Shot 2018-08-06 at 1.39.09 PM.png

If you would like to find out what these statistics mean to you, or if you are curious to know how much your property is worth today or how much you can afford to buy, please reach out. 

If you found this article helpful please hit "Like" and "Share".

1 Comment

GTA Housing Statistics Turn the Corner in June

2 Comments

GTA Housing Statistics Turn the Corner in June

Home sales in the Greater Toronto Area (GTA) were 2.4% higher in June 2018 than they were in June 2017, and the average selling price edged up on a year over year basis by 2%.  This is the first time since 2016 that unit sales increased year over year and now reverses the year on year trend of declining monthly unit sales seen every month since April 2016.   And new listings dropped from those recorded in June of last year by 18.6%, meaning that market conditions appear to be tightening, signalling that the housing market has turned the corner to a more positive course, as sales accounted for a 10.4% greater share of listings, up from 40.4% of active listings in June 2017 to 50.8% in June 2018.

Screen Shot 2018-07-05 at 3.30.43 PM.png
Screen Shot 2018-07-05 at 3.32.25 PM.png

There was also a change in the mix of properties sold in June 2018 compared to June 2017, with low-rise home types accounting for a greater share of sales at 63.2% this year compared to 61.0% last June.  Sales of Detached and Semi-Detached homes were up by 5.5% and 8.1%, respectively, year-over-year in June, while condominium unit sales decreased by 5.3% in the same period.

All of this is happening as a result of that fact that home buyers are starting to move back into the market, after adjusting to the regulatory impacts of the foreign buyers tax which took effect in April last year, and the generally higher borrowing costs and new mortgage qualification stress tests that followed.  The expectation is that we will see continued improvement in sales over the next year, although it is likely that issues related to the supply of listings will persist, leading to increased upward pressure on home prices as competition among buyers intensifies.

Finally, it is interesting to note that unit sales and selling prices were up in each and every month in 2018, reversing the trend that started in April of last year when the impact of the foreign buyers tax negatively impacted both numbers until housing activity rebounded somewhat in the fourth quarter, when buyers rushed to secure home ownership prior to the new stress tests coming into effect in January of 2018.   As the chart below also demonstrates, home ownership has proven to be a positive long-term investment.

Screen Shot 2018-07-05 at 3.33.22 PM.png

If you would like to find out what these statistics mean to you, or if you are curious to know how much your property is worth today or how much you can afford to buy, please reach out. 

If you found this article helpful please hit "Like" and "Share".


2 Comments

Kitchen renovation has greatest potential to boost a property’s sale price

Comment

Kitchen renovation has greatest potential to boost a property’s sale price

TORONTO, JUNE 28, 2018 – According to a cross-Canada survey of over 750 Royal LePage real estate experts, a kitchen renovation is the clear upgrade of choice with the potential to boost a property’s value by more than 12.5 per cent.[1] Both ranking second, a finished basement or a new bathroom has the potential to increase a property’s value between 2.5 per cent and 12.5 per cent, depending on the investment.

“To financially benefit from a home improvement project, you need to keep potential homebuyers in mind,” said Tom Storey, real estate agent, Royal LePage Signature Realty. “While updating a kitchen should increase your sale price, a pool can actually deter families with young children or those who are looking for less maintenance.”

Adding a pool or deck is considered the least worthwhile renovation to increase a property’s value with pricing potential limited to a maximum of 2.5 per cent of the value of the home.

For Canadians looking for more general guidance on where to focus their home projects, the vast majority of surveyed experts recommended interior renovations (95.0%) over exterior renovations (5.0%).

“Curb appeal is important but more time is spent indoors at the open house and that is where buyers typically fall in love with a home,” added Storey. “When renovating with the potential to sell, the most important thing to remember is to use colours and materials that are popular and not too personal.”

The survey showed that prospective sellers are willing to invest less than 2.5 per cent of a property’s value on home renovations prior to listing their home, which represents an investment of up to $15,138 on a property valued at $605,512[2] – the current median home price in Canada.

When asked which generation is the most likely to renovate their home, 45.1 per cent of surveyed experts said baby boomers, as many are planning to sell and downsize. They are also most likely to have the funds needed for a significant renovation.

“Baby boomers run the risk of their property selling for a lower price or languishing on the market for longer than expected if they held their property for a long period of time without updating periodically,” said Storey. “Although many buyers can see themselves making home improvements themselves, its very hard for a buyer to get excited or imagine living in a space that is run down or the decor reflects another generation.”

Popular Home Improvements

About the home renovations ROI survey.

The Royal LePage Home Improvement Survey polled 766 real estate advisors from across Canada, between June 20, 2018 and June 25, 2018. Each respondent was asked to complete an online survey composed of 8 questions on the value of popular home improvements.

[1] Statistic referenced in table Popular Home Improvements

[2] National Home Price Aggregate, Royal LePage House Price Composite, Q1 2018.

This article is curtesy of www.royallepage.ca.

I offer complimentary home evaluations. Please do not feel obliged to list and sell with me when you request your current home evaluation. I am always happy to help, and when you are ready, I will be available to provide you with my full real estate experience.

Request your home evaluation:

PLEASE CALL/TEXT AT 416-419-5226 OR EMAIL LUBA@LUBABELEY.COM

Comment

15-step Action Plan to optimize your ROI when Selling Your Home

1 Comment

15-step Action Plan to optimize your ROI when Selling Your Home

IT’S WAY MORE THAN JUST PUTTING A SIGN ON YOUR LAWN!

Is this the year you are planning to move? Every home owner arrives at this point sooner or later. It’s a big decision involving a major financial transaction so, when the time comes, you want to do it right.

If you, or anyone you know, is planning a move, here’s a 15-step action plan that can make the process easier and less stressful. 

How to get your home sold fast, at a premium price?

For most people buying a home is the single biggest investment they’ll ever make. When viewed as an investment, your home offers a major advantage over stocks, bonds, and mutual funds. The profits you make on all of these investments are subject to capital gains taxes.

That’s not the case when selling your home. Any profits you make from selling your principal residence are tax-free. So, when you decide to sell, it’s worth making an extra effort to capitalize on this special opportunity to make a sizable tax-free profit.

Because profits from the sale of your home are tax free, it makes good sense to invest in upgrades before selling. In many cases you can get a 100% plus return – over just a few weeks or months – on the funds you invest to upgrade, or renovate your home, prior to selling.


15-STEP ACTION PLAN TO OPTIMIZE YOUR ROI:


1.  Choose your REALTOR® carefully

Without a doubt, it is up to you to source the best representation for yourself. 

Today consumers get most of their information through their mobile phone, PC or a tablet. Be sure your real estate sales person/broker has a strong online presence, and utilizes state-of-the-art digital marketing tools including email, Facebook and Instagram.

Tips on How to Improve your property value here.

2.  Audit your agent’s marketing efforts

92% of homebuyers start the house hunting process online. What your agent posts online to describe your home is vitally important. If the agent’s description isn’t compelling, most house hunters won’t take the trouble to visit the property. Lots of quality pictures are important too. Make sure your agent uses a professional high-end photographer that knows how to capture the best features of your home. A great description and stunning pictures will make your home stand out in crowd and drive buyer traffic.

3.  Plan the time to sell when markets are hot

Like everything else real estate markets are cyclical. Prices may vary by 5% or more between the peak and lowest periods over any given year. A good Realtor can help you determine the best time to list your home.

4.  Pricing your home to sell

When a home is priced too high, it may remain unsold for a period that’s more than other properties in the same neighborhood. This will cause prospective buyers to think there’s something wrong, further dampening demand for the property.

When pricing your home it’s important to follow your agent’s advice. A good agent will know the pricing strategy to get you the best deal.

5.  Exterior staging

First impressions are important when selling a home. If the exterior of your home looks shabby or run down, prospective buyers are turned off before they go through the front door. Before putting it on the market, be sure to spruce up your home’s exterior. Cut the grass, be sure the garden is weed free, and edged so it looks cared for. Repaint trim around the windows and the front door. Make sure the curb appeal suggests a cared for and well maintained home.

Tip: If you are planning to sell in the winter be sure to take some summer photos of the gardens, front and back yards.

P9220255.jpg

6.  Interior staging

This can involve renting furniture or classy art to hang on the walls of your home, placing fresh flowers in the living room and kitchen, and re- arranging furniture. Many agents offer free interior staging as part of their service. It’s usually best to outsource your home’s staging to a professional who knows the how to present a home to look its best.

7.  Consider doing upgrades or modest renovations before listing

Relatively simple upgrades can add tens of thousands to the price your home goes for. Here are examples of upgrades that can give you a high return on investment: upgrade lighting, a new coat of paint, replace shabby or scarred countertops in the kitchen and bathroom with marble or granite, replace outmoded appliances such as refrigerators, ranges or microwave ovens. Your real estate agent can suggest upgrades that are right for your specific home and neighbourhood.

8.  Understand important real estate terms and strategies

These include: holding back offers, multiple offers situations, special conditions in offers, legal terms and clauses, offer sign-backs, and irrevocable dates. Your agent can guide you through all of the important terminology and critical dates during the house selling and offer review process.

9.  Do a video tour of your home and, post it on YouTube

Be sure your agent has a copy too. Take viewers on a room-by-room tour, showcasing the home’s best features. Don’t forget to include the garden, patio and other outdoor features. Rave about the neighbourhood and neighbours; give details about nearby restaurants, shops, schools, libraries, sports facilities, parks etc. Reminisce about great times you’ve enjoyed in the home. Let viewers know this has been a happy place, and it will be missed when you’ve moved on.

10.  Commission a professional home inspection

This is especially important if you live in an older neighborhood where some of the homes may have asbestos insulation, termites, out of date pipes and wiring, etc. By having a qualified home inspector certify your home is free of these threats you can avoid having a prospective buyer commission their own inspection that may reveal issues you are not aware of. This will also speed up the selling process, as prospective buyers will not have to take the time to arrange their own inspection.

11.  Be prepared to leave an expensive appliance for the new owner

Some buyers will covet your big screen TV, a sound system, new appliances etc. These items can be great bargaining chips when negotiating a price with prospective buyers.

12.  Provide your agents with lots of access time

This is vitally important. Even if it’s sometimes inconvenient, be prepared to make your home available for prospective buyers. No one will buy without having gone through your home. If yours is unavailable when a prospective buyer wants to see it, they may buy the next home they visit.

13.  Clean and Declutter

Stash away your tchotchkes old magazines, children’s toys, hobby paraphernalia etc. Keep countertops and furniture free of clutter. Buyers are drawn to clean spaces and shiny surfaces so make sure all of the dust bunnies have been swept up and all rooms are clean and dust-free. Use furniture polish on tables and wood furniture before each home viewing. This will ensure your home looks well maintained, and the smell of wood polish will not go unnoticed.

14.  Remove personal items that may be offensive to some buyers

These includes religious items, odd collections such as shrivelled heads, skulls, animal head mounted on the wall, or posters with messages that could be considered offensive. 

15.  Put away personal items and family pictures

You want prospective buyers to envision your old house as “their new home”. Let them see there is space for their family pictures. It’s also important to keep your medications and over the counter healthcare products tucked away in your medicine cabinet or a bedside table. You don’t want prospective buys envision your home as a place of sickness.

In addition you may read more about the Selling Process here.

PB030394.jpg

REQUEST A HOME EVALUATION

I offer complimentary home evaluations. Please do not feel obliged to list and sell with me when you request your current home evaluation. I am always happy to help, and when you are ready, I will be available to provide you with my full real estate experience.

PLEASE CALL/TEXT AT 416-419-5226 OR EMAIL LUBA@LUBABELEY.COM

YOU DESERVE TRULY OUTSTANDING SERVICE!


1 Comment

May Market Report - Steady Price Growth in the GTA Housing Market

Comment

May Market Report - Steady Price Growth in the GTA Housing Market

In May, we saw a continuation of the steady price growth experienced in the Greater Toronto Area (GTA) housing market during the 4 previous months.  So far, in the first 5 months of 2018, average home prices in the GTA have increased by 9.6%, to $805,320.  Unit sales have also increased each month in 2018 - from 4,019 units in January, to 7,834 units in May.

As I mentioned in last month’s blog, the housing market conditions in 2018 are very different than the conditions experienced during the comparative period in 2017.  But beginning in May, and through the second half of 2018, the comparisons will become more meaningful, as May, 2017 was the first month last year when the impact of the foreign buyers tax began to effect a slowdown in the rate of price growth and market activity, following the frenzy in the months prior when prices were bid up to unreasonable levels due to short supply and speculation.  So for the first time, we have the impact of the foreign buyers tax in both monthly results year-over-year, which makes a May to May comparison a little more relevant.

It is interesting to note, therefore, that new listings were down by more than sales this May compared to last year, (26.2% versus 22.2%), meaning that competition heated up among buyers.  And there are indications from sellers that listing intentions are down significantly since the Fall, meaning the supply of homes available for sale could continue to be an issue in the latter half of 2018.  And when the supply of homes decreases, prices increase, as competition among buyers intensifies.

This is particularly true in the City of Toronto (416) where, for example, average selling prices were at or above average listing prices for all major home types in May.  What is even more interesting, is that the further out you travel from Downtown Toronto, the weaker the market gets.  And since the GTA housing numbers are an average over the entire 416 and 905 regions, this proves how strong the market is right now in the City of Toronto, compared to the rest of the GTA, as the following chart shows:

Screen Shot 2018-06-14 at 4.14.17 PM.png

Finally, these last two charts highlight the composition of the May sales by home type in each of the 416 and 905 sub markets.  In the 416 region, condominiums accounted for a commanding 57% of unit sales and detached homes made up 25%, while in the 905 region it was detached homes that accounted for the majority of unit sales, at 55% of the total.  What these charts clearly indicate is that condominiums are the dominant force driving unit sales in the 416 region and are in high demand compared to higher priced detached homes, while the opposite is true in the 905 region where the inventory of detached homes tends to be more prevalent and buyers have more choice, which means these homes take longer on average to sell.

If you would like to find out what these statistics mean to you, or if you are curious to know how much your property is worth today or how much you can afford to buy, please reach out. 

If you found this article helpful please hit "Like" and "Share".

Comment

Turning your single-family home into income generating property

Comment

Turning your single-family home into income generating property

Let's take a look at turning your single-family home into a two-family, income generating property. This strategy can be an attractive alternative for empty-nesters and retirees who’d prefer not to move – and who’d be happy to generate some extra income.

At some point, usually after the children have moved out, many home owners decide to downsize. Today, that usually means moving into a condo or to a smaller community.

But many couples would prefer to stay in the family home, continuing to enjoy the neighbourhood they know so well. Here’s an alternative for anyone considering their options in such a situation.

Why not re-configure your home into a two-family, income-generating property? This strategy has a number of advantages.

  • You get to stay in the home and the neighbourhood you love

  • You can avoid many of stressors involved in adapting to a new neighbourhood, new neighbours, and unfamiliar amenities and services.

  • You end up with less home to manage.

  • You can generate important extra income to help fund your retirement years and lifestyle enhancements.

  • You may significantly increase your property’s value when it’s reclassified as an income property.

Offsetting these advantages, you’ll have to deal with some challenging realties:

  • Living through the renovation process, likely four months to a year. During this period, you might have to find a temporary residence.

  • Financing the renovations.

  • Managing the renovation process to be sure it meets your expectations and stays within budget.

  • Living alongside tenants who may not share your lifestyle.

  • Assuming the role of “property manager” – this means, at a minimum, dealing with occupancy, rent collection and maintenance issues.

P6180314.jpg

Should you decide to re-configure your home to generate an income, here’s an ACTION PLAN to get the process underway.

Zoning and Permits

First, you’ll need to check out zoning issues. Is your area zoned for the living arrangement you’re hoping to create? Do you need to apply for rezoning or get a zoning restriction waiver?

Requirements vary from region to region, although there are some basics that will apply almost anywhere – each residence will need at least one exit of its own, plus bedroom, bathroom and kitchen area, and perhaps separate utilities and meters. 

Other safety standards, such as fire codes, might change once you turn the space into a two-family dwelling – such information is available from your local building planning department.

Space planning

You’ll need to consider what kind of people you want to occupy the new space – a family, students, another retired couple? This will affect the number of rooms and their sizes, the design of kitchen and bathroom spaces, and other considerations. 

If you need or want to make big changes, consult with a structural engineer. This is the time to think about major issues like the building’s envelope, and to fix any deficiencies or reconfigure the roof, walls, windows or doors.

Determine the rental income you can expect

Contact a real estate agent you trust to determine the rental income you can expect to earn, taking into consideration periods when the unit is vacant. As part of this analysis, find out how this revenue will be taxed, and what portion can be offset as expenses when you file.

Financing

You may need to take out a home improvement loan, a business loan, or even a second mortgage. Prospective lenders will need to factor in a number of elements: the use of second unit, your credit rating, etc. Ask your real estate agent to provide you with a home valuation before beginning.

Retain an architect

To be sure your re-configured property is in compliance with local zoning, building codes and safety regulations, retain an architect with local knowledge and expertise in handling this type of project. Be sure to get at least two or preferably three quotes.

Recruit a construction company

Be sure the company is experienced in this kind of project. Get at least three quotes. Have the company you select meet with the architect to work out potential issues before the construction process begins. 

Have qualified back-up in place to help keep the project on track. It’s always a good idea to have someone who cares for you to act as your back-up or to offer support as you go through the renovation process. Maybe one of your grown children, or a close friend.

Should you wish to explore this alternative to downsizing, I’d be pleased to help you assess this opportunity in respect to your specific home.

If you found this article helpful please hit "Like" and "Share".

Comment

SOPHISTICATED BOLD KITCHEN COLOURS

Comment

SOPHISTICATED BOLD KITCHEN COLOURS

Hello May! Sunny days are finally here. Japanese Cherry blossoms are reflecting the warmth of the sun and the earth and expressing their beauty in full boom! This time of the year makes me very happy - time for awaking, rebirth and celebration of nature. Be sure to check out the beauty of the cherry blossoms in High Park now!

As you know, I'm always on the hunt for something new and interesting, especially when it comes to interior design. 

If you were looking for new ways to update your kitchen, did you think of painting your kitchen cabinets in the colour that's not grey, brown, beige or white? Try some of these bold and vibrant hues that truly transform the space. Choosing a colour isn't easy, that's why Benjamin Moore and other companies offer a variety of tips how to do it right. Be brave, be daring and enjoy!

Images are curtesy of www.houzz.com.

Comment

April Market Report  |  Which Headline Tells the True Story?

Comment

April Market Report | Which Headline Tells the True Story?

Average Selling Price for Homes in the GTA up 9.2% Year to Date, OR

Average Selling Price for Homes in the GTA down 12.4% in April Year-Over-Year?

Well, both are true actually.  But which one is more relevant?

I believe the first headline is more relevant, because it tells us what is happening in the current real estate market.  We already know that the GTA real estate market reset from its historical highs (in April, 2017 the GTA recorded the highest ever average selling price) after the introduction last year of the foreign buyers tax in Q2, followed by the more restrictive mortgage qualification rules introduced at the beginning of 2018.  Add to those measures the 2 successive increases in interest rates by the Bank of Canada and the market cooled down considerably.

Headlines are meant to grab the reader’s attention.  And one could argue that negative headlines tend to attract more attention than positive ones.  But the facts are that the GTA real estate market is trending positive, despite being off its historical highs.  Take a look at these statistics for the first 4 months of 2018:

Screen Shot 2018-05-08 at 2.03.08 PM.png

Unit Sales and Active Listings have increased in each month.  Average selling price is up 9.2% in four months.  Days on the Market have gone down by more than a third, and Average Selling Price to List Price is stable.  These are all signs of a healthy real estate market.

But the GTA real estate market is really a tale of 2 cities.  As reported by TREB in their latest Market Watch:

“The year-over-year change in the overall average selling price has been impacted by both changes in market conditions as well as changes in the type and price point of homes being purchased.  This is especially clear at the higher end of the market.  Detached home sales for $2 million or more accounted for 5.5% of total detached sales in April 2018, versus 10 per cent in April 2017.”

The differences in the composition of the current GTA real estate market can seen by looking at the following statistics broken down by major home type:

Screen Shot 2018-05-08 at 2.02.42 PM.png

There is roughly a 3 month supply of detached homes for sale in the GTA, whereas there is only a 1 ½ month supply of condominium units for sale. As well,  the increase in Average Selling Price for Condominiums, at 10.2% for the first four months of 2018, is outpacing the rate of increase for Detached homes, at 6.1%, as there is obvious pressure at the lower end with Condominiums in short supply.  TREB expects that “once we are past the current policy-based volatility, home owners should expect to see the resumption of a moderate and sustained pace of price growth in line with a strong local economy and steady population growth”.

If you would like to find out what these statistics mean to you, or if you are curious to know how much your property is worth today or how much you can afford to buy, please reach out.

If you found this article helpful please hit "Like" and "Share".

Comment

GTA March Housing Stats – a stark contrast from 2017

1 Comment

GTA March Housing Stats – a stark contrast from 2017

Toronto Real Estate Board Director of Market Analysis Jason Mercer perhaps sums up the Q1-2018 Greater Toronto Area housing market best:

“Right now, when we are comparing home prices, we are comparing two starkly different periods of time: last year, when we had less than a month of inventory versus this year with inventory levels ranging between two and three months.  It makes sense that we haven’t seen prices climb back to last year’s peak.  However, in the second half of the year, expect to see the annual rate of price growth improve compared to Q1 as sales increase relative to the below-average level of listings.”

Now look at this chart, which shows those two “starkly different periods of time”.   What the chart shows is the huge run up in prices in the first half of 2017, followed by a reality check, as prices declined rapidly in Q3, after the introduction of government measures to cool the market.  Prices rebounded somewhat in Q4, as some buyers and sellers accelerated their property ownership decisions prior to the introduction of the more stringent lending guidelines which came into effect in January, 2018.  And now, we are back to some period of relative normalcy, with modest price appreciation in Q1-2018.

So it doesn’t really matter that units sales were down by almost 40%, from 11,954 units in March, 2017 to 7,228 units in March, 2018, or that prices were down on average by 14.3%, from $915,126 to $784,558 because these results cover two starkly different periods of time, and are, therefore, not comparable.

What is meaningful, however, is that the number of active listings in March, 2018 was 103% higher than the level in March, 2017 and that the average time it took to sell a home in March, 2018, at 20 days, was roughly the same amount of time it took back before the market went crazy in Q1-2017, when the average time it took to sell a home in the GTA was below 10 days.  And the average selling price has actually increased in each of the last 3 months.  I’ve said it before and it bears repeating that we are in a balanced market, one which TREB believes is poised for stronger growth later in 2018, particularly in the condominium market where prices have been steadily on the rise and inventories have become ever more scarce.

If you are curious to know how much your property is worth today or how much you can afford to buy, please feel free to reach out; and if you found this article helpful please hit "Like" and "Share".

1 Comment

What’s the difference between an Agent, Salesperson, Broker and a REALTOR®?

Comment

What’s the difference between an Agent, Salesperson, Broker and a REALTOR®?

You’ve heard many terms when referring to people who sell real estate. What’s the difference between an Agent, Salesperson, Broker and a REALTOR®?

Yes, the terminology can be confusing. While it may not seem important to know the difference between these terms, there are some common traits and useful distinctions to be aware of when you look to buy or sell a home.

Let’s start with the most commonly misused term, “agent”. While most people would use that term to describe the individual real estate professional assisting them, that’s not technically correct; legally, “Agent” is actually the term given to the brokerage (the company) that represents you as the buyer or seller. An agency relationship is formalized when you sign a contract either in the form of a buyer representation agreement or a typical listing agreement. These are between buyer/seller and the brokerage, not the individual representative.

A real estate salesperson or broker will be the person who presents and explains the representation agreement to you on behalf of the brokerage. In most cases, they will also usually be the same person who represents you during the buying or selling process, on behalf of the brokerage.

Salespeople and brokers are both real estate professionals who are subject to regulation under the Real Estate and Business Brokers Act, 2002. They must be employed by a real estate brokerage and must be registered with RECO (Real Estate Counsel of Ontario) in order to trade in real estate in Ontario. More info at RECO.on.ca

Education is what distinguishes a broker from a salesperson. A salesperson achieves the broker designation by successfully completing the Broker Registration Education Program. This course will provides an overview of how to establish, operate, and manage a real estate brokerage. More info at OREA.com

What's the definition of a REALTOR®? REALTOR®, REALTORS® and the REALTOR® logo are certification marks owned by REALTOR® Canada Inc., a corporation jointly owned by the National Association of REALTORS® and CREA.

Not all real estate agents are REALTORS®.

The REALTOR® trademarks are used to identify real estate services provided by brokers and salespersons who are members of CREA and who accept and respect a strict Code of Ethics, and are required to meet consistent professional standards of business practice which is the consumer’s assurance of integrity. More info at CREA.ca

If you found this article helpful, please hit "Like" and "Share"! 

Comment

How do the Month of February Results Compare to the Long-term Trends in the GTA Housing Market?

Comment

How do the Month of February Results Compare to the Long-term Trends in the GTA Housing Market?

The Toronto Real Estate Board (TREB) released its February Stats on March 6, announcing that Greater Toronto Area REALTORS® reported 5175 residential transactions through TREB’s MLS® System in February 2018.  This result was down by 34.9% compared to a record 7,955 sales reported in February, 2017.  The overall selling price fell by 12.4% year-over-year to $767,818 from $876,336.  But remember, prices spiked in the first quarter of 2017.  If you put that aside and compare this result to February 2016, you will note that prices in February 2018 remained 12% higher than the average reported for February 2016, and that represents an annualized increase which is well above the inflation rate for the past 2 years.

Active listings increased by 147.4%, from 5,400 a year earlier to 13,362 in February 2018, accounting for an increase in inventory levels to roughly 2.6 months of supply in 2018, from the unhealthy 0.7 ratio seen last February.

Last month I presented some charts showing what was going on in the market on a micro basis, compared to the past 5 years.  This month, I’m digging deeper, going back 10 years, but on a more macro level.  The solid horizontal line in each of the following charts shows the 10-year average value for the metric being measured.  And, except unit sales for the month of February 2018, which were off significantly from their 10-year average, the charts present a pretty clear picture that February 2018 produced results that were very close to historical averages for that month.

Screen Shot 2018-03-09 at 7.06.36 PM.png

In fact, average overall prices in February, 2018 were just slightly off their 10-year trend average growth rate (green line below), mostly because the abnormally high run-up in prices in 2017 that was caused by demand-supply imbalances, (particularly in single family detached homes) pushed the trend line upwards.  Another interesting observation is that although February 2018 prices on average were down by 12.4% when compared to February 2017, condominium prices (the blue column in the chart below) continued their upward trend, increasing by another 10.1% over their February 2017 record level.  And condominium prices are now trending above their 10-year average growth (blue line below).

Luba Beley Market Report

This next chart shows that the market is a more balanced one in February 2018 than it was in either February 2016 (when inventory of homes for sale was extremely low at just over 1.5 months of supply) or February 2017 (when inventory was almost non-existent).  Inventory compared favourably in February 2018, at 2.6 MOI, to the historical average of 2.4 months of supply.

Screen Shot 2018-03-09 at 7.05.09 PM.png

Lastly, a comment on interest rates – the Bank of Canada decided not to increase its benchmark interest rate this month from its current level of 1.25%, adopting a cautiously negative tone about the growing uncertainty for the global and Canadian outlooks as a result of the U.S. trade policy which is edging towards more protectionism and higher tariffs.  Home buyers can breathe a sigh of relief (however brief) that interest rates will likely remain at their current levels for at least another quarter.

If you are curious to know how much your property is worth today or how much you can afford to buy, please feel free to reach out; and if you found this article helpful please hit "Like" and "Share".

Comment

March Market Report - Pictures Say It All

March Market Report - Pictures Say It All

The market has returned to a more balanced one, reflecting the same characteristics as it did back in January 2014 and here is why.

The Toronto Real Estate Board (TREB) released its January Stats on February 6, announcing that Greater Toronto Area REALTORS® reported 4,019 residential transactions through TREB’s MLS® System in January 2018.  This result was down by 22% compared to a record 5,155 sales reported in January, 2017.  The overall selling price fell by 4.1% year-over-year to $736,783 from $768,351, with the decline being weighted toward the detached segment of the market, continuing the trend seen in the latter half of 2017.  Active listings increased by 136.3%, from 5,034 a year earlier to 11,894 in January 2018, accounting for an increase in inventory levels to roughly 3.0 months of supply in 2018, from the unhealthy 1.0 ratio seen last January.

Now I want to show you some pictures that put these statistics into historical perspective.  And the results may surprise!  January home sales increased by roughly 1,000 units from 4,103 units in 2014 to 5,155 units in 2017, then decreased in 2018 back to the 2014 level.  What is interesting, however, is that the mix of sales by major home type during the 4-year period saw the share of condominiums as a percent of total unit sales rise by 5.4%, from 26.7% of the total in 2014 to 32.1% in 2018, while the share of higher priced detached and semi-detached homes decreased by 5.4%, from 46.2% of the total to 41.8%.  The shift was most dramatic from 2017 to 2018, as affordability became a major issue, particularly for first time home buyers who have flooded the condominium market.

Screen Shot 2018-02-08 at 10.25.29 AM.png

After a period of declining interest rates, it appears that the recent Bank of Canada increases are setting the stage for further interest rate increases on the horizon.  But interest rates today are essentially the same as they were in January 2014.

Interest rates Luba Beley

The market has surely returned to a more balanced one, reflecting the same characteristics as it did back in January 2014, when the inventory of homes (MOI) stood at roughly 3 months of supply, indicating that on average a home took 3 months to sell in 2014, exactly the same amount of time as it would in 2018, but a far cry from January 2017 when the inventory of homes was at an historically low of 1 month supply.

Year-Over-Year Summary/ Luba Beley

Lastly, although prices were down on average by 4.1% year-over-year this January, they are still up a cumulative 49.3% - from $526,965 in 2014 to $736,783 in 2018 - for the average home sold in the GTA.  Interestingly, the average annual price increase for detached homes in the 4-year period was 9.0% per year, compared to the average annual price increase for condominiums of 10.0% per year, but with lower priced condominiums making up a larger share of the total unit sales in 2018 than they did in 2014, this brought the overall annual increase in prices down to 8.7% per year on average for all housing types during the 4-year period.

Average price by major home type/ Luba Beley

If you are curious to know how much your property is worth today or how much you can afford to buy, please feel free to reach out; and if you found this article helpful please hit "Like" and "Share".


Adjusting Expectations - 2017 GTA Housing Market in Review

Comment

Adjusting Expectations - 2017 GTA Housing Market in Review

The Toronto Real Estate Board (TREB) announced that Greater Toronto Area (GTA) REALTORS® reported 92,394 sales through TREB’s MLS® System in 2017.  This total was down 18.3% compared to the record sales reported in 2016.

But let’s put the 2017 sales into an historical perspective.  Even if we include the record sales of 101,213 in 2015 and 113,040 in 2016 in the equation, the GTA recorded 95,916 sales per year on average over the five year period from 2012 to 2016.  Taking that into consideration, 2017’s results are only off by 3.7% from the 5-year average.  In addition, there has been only one other year (besides 2015 and 2016) when sales breached the 93,000 mark, and that was in 2007, before the “Great Recession”, when the GTA recorded 93,193 sales.

After record sales in all segments of the market in Q1, the pace of sales decline in Q2 and Q3 after the Ontario Fair Housing Plan (i.e. the foreign buyers tax) was introduced. Q4 brought back some strength to the market as some buyers arguably brought forward their home purchase to beat the introduction in January of 2018 of the changes to the federal mortgage lending guidelines (the “stress test”).

Despite the drop of 20,646 annual sales from the 2016 figure, the average sales price recorded in the GTA for 2017 as a whole rose by 12.7% to $822,681, from $729,837 in 2016, although home price growth in the second half of 2017 differed substantially depending on market segment.  The drop was felt primarily in the most expensive detached market segment, where sales dropped by 12,381 homes or 23.0%, but representing almost 60% of the total unit sales decrease of 20,646 units.  The average price of a single detached home in the GTA increased in 2017 by 12.7% to $1,098,951, forcing many buyers to look for less expensive options.  At the other end of the market spectrum, condominium apartments experienced a drop of 2,853 unit sales, or 9.6%, accounting for approximately 13.8% of the total decrease of 20,646 units, but prices in this segment were up 23.1% from 2016 levels to an average of $512,478 in 2017.

These factors also contributed to the shift in relative share of total sales where the percentage of single detached homes decreased by 2.8% to 44.7% of units sold and the share of condominium apartments rose by 2.8% to 29.1% of total units sold.  Expectations are that as more millennials begin to reach the age of home ownership, the trade-off between housing type and location will likely become more prevalent in the future across the GTA and this will also place a significant strain on inventory, turning the process of finding a home into an exercise in adjusting expectations.

According to Royal LePage’s most recent Market Survey Forecast, the company predicts that the aggregate price of a home in the GTA will appreciate by 6.8% by the end of 2018, as many purchasers become acclimatized to the new mortgage rules and continue to compete over low inventory levels, particularly in the condominium market where demand significantly exceeds supply due to the long lead times in building these units. 

If you are curious to know how much your property is worth today or how much you can afford to buy, please feel free to reach out; and if you found this article helpful please hit "Like" and "Share".


Comment

Are buyers rushing to avoid the stress?

1 Comment

Are buyers rushing to avoid the stress?

It appears that home buying activity in the GTA is ramping up for a strong December if the November results are any indication.  The Toronto Real Estate Board reported 7,374 transactions through TREB’s MLS system in November, bucking the regular seasonal trend which usually sees transactions slow in the last couple of months of the year.

It’s possible that the changes to mortgage lending guidelines, which come into effect in January (the “stress test”), have prompted some households to speed up their home buying decisions before their home choices become more limited as affordability will drop when the new rules are applied.

TREB reported that there were 18,197 active listings across the Greater Toronto Area (“GTA”) in the month of November, an increase of over 110%  compared to the same month in 2016 and inventory remained stable at roughly 2 ½ month’s supply.

What is more interesting, however, is what happened on a micro level.  In the City of Toronto, for instance, there were 2,978 reported transactions, representing 40% of the GTA total, but with only 5,430 active listings, available inventory was much lower than the GTA average, at 1.8 months.  Another interesting statistic is that detached homes represented almost 60% of the active listings in November, meaning that there is a much greater supply at the higher end of the price range, where inventory stood at almost 3 ½ month’s supply, or an additional 1 month above the GTA average.

Demand continued to be strongest at the lower end where inventories of the more affordable home types were 1.8 months for semi-detached homes, and 1.6 months for condominiums.

The average selling price in the month of November for all homes types combined was $761,757 - down by 2 per cent compared to the month of November, 2016, due in part to a smaller share of detached home sales versus last year.  On a year to date basis, however, the average selling price was up by 13.4 per cent compared to the same period last year, with high density home types (i.e. condo townhouses and apartments) leading the way in terms of price growth.

My predictions?  Look for a more active than usual December month as buyers continue to speed up their home buying decisions to “avoid the stress” that will be caused by the new mortgage lending qualification rules and the likelihood of further interest rate hikes in 2018.  The first 90 days of 2018 will probably lead to a slowdown in transactions as buyers navigate the new regulatory landscape and inventories will likely edge up to slightly more than 3 month’s supply on average for the next few months.

Wishing you happiness, good health and prosperity in the New Year!

If you are curious to know how much your property is worth today or how much you can afford to buy, please feel free to reach out; and if you found this article helpful please hit "Like" and "Share".

1 Comment

Signals of a Healthy GTA Real Estate Market Continue

Comment

Signals of a Healthy GTA Real Estate Market Continue

There were a total of 7,118 residential sales reported through TREB’s MLS system in October, compared to 9,715 transactions a year ago.  Even though the number of transactions was down by 26.7% year-over-year, the jump of almost 12% in residential sales reported between the months of September and October in 2017 was more pronounced than usual compared to the last 10 years, a clear signal that market momentum is picking up.

Active listings were 78.5% higher than a year ago, an indication that supply and demand are continuing to balance out as inventories settled at 2.6 months of supply in October, down marginally from the 3.0 months of supply in September, but still much healthier than the scant 1.1 months of supply experienced in October, 2016.  There is, however, a continuing lack of quality listings in core GTA neighbourhoods and there are early indications that offer dates are reappearing as homes are being underpriced to generate bidding wars, although this has yet to manifest in the overall selling price to list price ratio which is currently holding at 98%.

While the average selling price for October transactions was $780,104 – up by 2.3% compared to the average of $762,691 in October 2016 -  the continuing low supply of, and high demand for, condominiums fuelled a 21.8% increase in prices in that segment of the market.

Expectations are that market activity will pick up further in the next 6-8 weeks as buyers rush to obtain mortgage pre-approvals and submit offers before the new stress tests announced by OSFI last month are implemented at the beginning of 2018, further reducing buying power as the pre-qualification hurdle rate increases to the higher of the 5-year benchmark rate published by the Bank of Canada or your negotiated contract borrowing rate + 2%.

Do you remember the story of Goldilocks and the Three Bears?  When Goldilocks arrived at the bears’ house in the forest there were three bowls of porridge on the table and she was hungry. The first bowl of porridge she tried was “too hot”, the next one was “too cold”, but the third one was “just right”.  Well, this just might be a “Goldilocks” moment in the GTA housing market!

If you are curious to know how much your property is worth today or how much you can afford to buy, please feel free to reach out; and if you found this article helpful please hit "Like" and "Share".


Comment

Renting or Buying? New Regulations Are Making Affordability More Difficult

Comment

Renting or Buying? New Regulations Are Making Affordability More Difficult

Beginning January 1, 2018, if you are buying a home, even if you have equity of 20% or more, a new regulation announced this week by OSFI (the Ontario Superintendent of Financial Institutions) could make it more difficult for you to qualify for a mortgage.

The revised Residential Mortgage Underwriting Practices and Procedures include several key changes that the regulator says is part of its expectation that federally-regulated mortgage lenders remain vigilant in their underwriting practices, the most significant of which is a new “stress test”.

One fear hitting the headlines today is that the impacted borrowers will turn to unregulated lenders including credit unions and caisses populaires, which are not subject to the new rules.

 If you stay with the same institution, banking competition will be even further restricted as those renewing mortgages will not have the ability to shop around. Great for the banks!

In order to qualify for an uninsured mortgage the minimum qualifying rate for uninsured mortgages will be the greater of the five-year benchmark rate published by the Bank of Canada or the contractual mortgage rate +2%.  So if the Bank of Canada five-year rate is 5% and you are able to negotiate a lower rate from your financial institution – say 3.5%, then the stress test will mean that you would otherwise have to qualify for a 5.5% rate mortgage in order to be approved.  Alternatively, if you were only able to negotiate a 50 basis point reduction from the posted rate, or 4.5%, then you would have to show that you would qualify for a 6.5% rate mortgage of the same amount.  What this will likely mean for most borrowers, is that they will not be able to afford the home that they thought they could before the change in regulations.

For example, as reported by TREB (The Toronto Real Estate Board) the average price of a semi-detached home in the GTA in September, 2017 was $752,379.  A buyer with a 20% down payment would need a mortgage of approximately $600,000 in order to purchase this “average” home.  Let’s say that the Bank of Canada five-year benchmark rate is 5.0% and that this purchaser was able to negotiate a rate of 4% with their financial institution.  Therefore, the purchaser would have to demonstrate that they could afford the payments on a 6% mortgage of this amount (roughly an additional $350.00 per month or $4,200.00 per year on a monthly pay mortgage amortized over 25 years), otherwise they would only qualify for a smaller mortgage.  If they could not come up with that extra income to show that they would qualify for a $600,000 mortgage under the new regulation, then they would have to settle for a mortgage of $545,000, meaning that with their $150,000 down payment they could only afford a home priced around $695,000, or roughly 8% less than the price of the average semi-detached home selling currently in the GTA.

So for many, the alternative will be to look for a smaller home to purchase, perhaps a less expensive condominium, rent or move out of the city.  And sadly, the news does not get much better with those alternatives, due to the shortages of available units in both the sales and rental markets for condominiums.  And affordability is becoming a real issue as the focus of buyers and renters alike has shifted to condominiums, bidding up prices both for units for sale and units for rent.

Urbanation just released its analysis of this year’s third quarter and found condo rents averaged $2,219 a month for units averaging 743 square feet – a $232 year-over-year increase. It also found that newly signed leases in the third quarter, at 7,761, hadn’t much changed in a year.

A new report commissioned by the Federation of Rental-Housing Providers of Ontario says the Liberal government’s Fair Housing Plan has negatively impacted the province’s rental housing supply. Before the introduction of the government legislation, 28,000 rental units were in the planning pipeline, but since the new rules were introduced 1,000 of those units have been cancelled or converted to condominiums. The report estimates that if 6,250 new rental units are not built per year in Ontario supply will continue to drop and naturally drive the demand up and the prices.

A lot of factors have conspired to put relentless pressure on the rental market – the astronomical cost of homeownership, stricter mortgage qualifications, high migration and the Fair Housing Plan, among others – but none has been more pronounced than the supply shortage.  Moreover, the reintroduction of rent control has provided tenants increased incentive to remain in their dwellings, stunting the turnover rate.

Tim Hudak, CEO of OREA (The Ontario Real Estate Association) recently had this to say about the latest regulation. “It’s time for governments to hit the brakes on more demand side policy interventions and take a wait and see approach. Ontario’s housing market is too important to the provincial economy to move ahead with unnecessary regulation that will hurt the dream of home ownership.”

If you are curious to know how much your property is worth today or how much you can afford to buy, please feel free to reach out; and if you found this article helpful please hit "Like" and "Share".

Comment

Expanding Regional Economies to Lift Home Prices in Canada’s Major Markets

Comment

Expanding Regional Economies to Lift Home Prices in Canada’s Major Markets

Shorter than anticipated housing market correction puts Toronto back on track 

Highlights:

  • Toronto to have a shorter housing correction than seen in Vancouver

  • Tighter access to mortgage financing and eroding affordability in Vancouver and Toronto have more buyers shifting their focus to condominiums, putting upward pressure on price appreciation

  • Rising interest rates and a strong Canadian dollar support more moderate home price appreciation

TORONTO, October 12, 2017 – According to the Royal LePage House Price Survey [1], home prices in Canada’s five most populated housing markets are rising at a similar, healthy pace on a quarter-over-quarter basis, the first time this has occurred in six years.

The year-over-year price change data in the Royal LePage House Price Composite is the most useful metric for determining the health of Canada’s real estate market. However, examining quarter-over-quarter movements can reveal useful short-term housing market trends. In the third quarter, home prices in the Greater Toronto Area, Greater Vancouver, Greater Montreal Area, Calgary and Ottawa all rose at rates between 1.5 and 3.5 per cent on a quarter-over-quarter basis, indicative of a much more balanced Canadian residential real estate market.

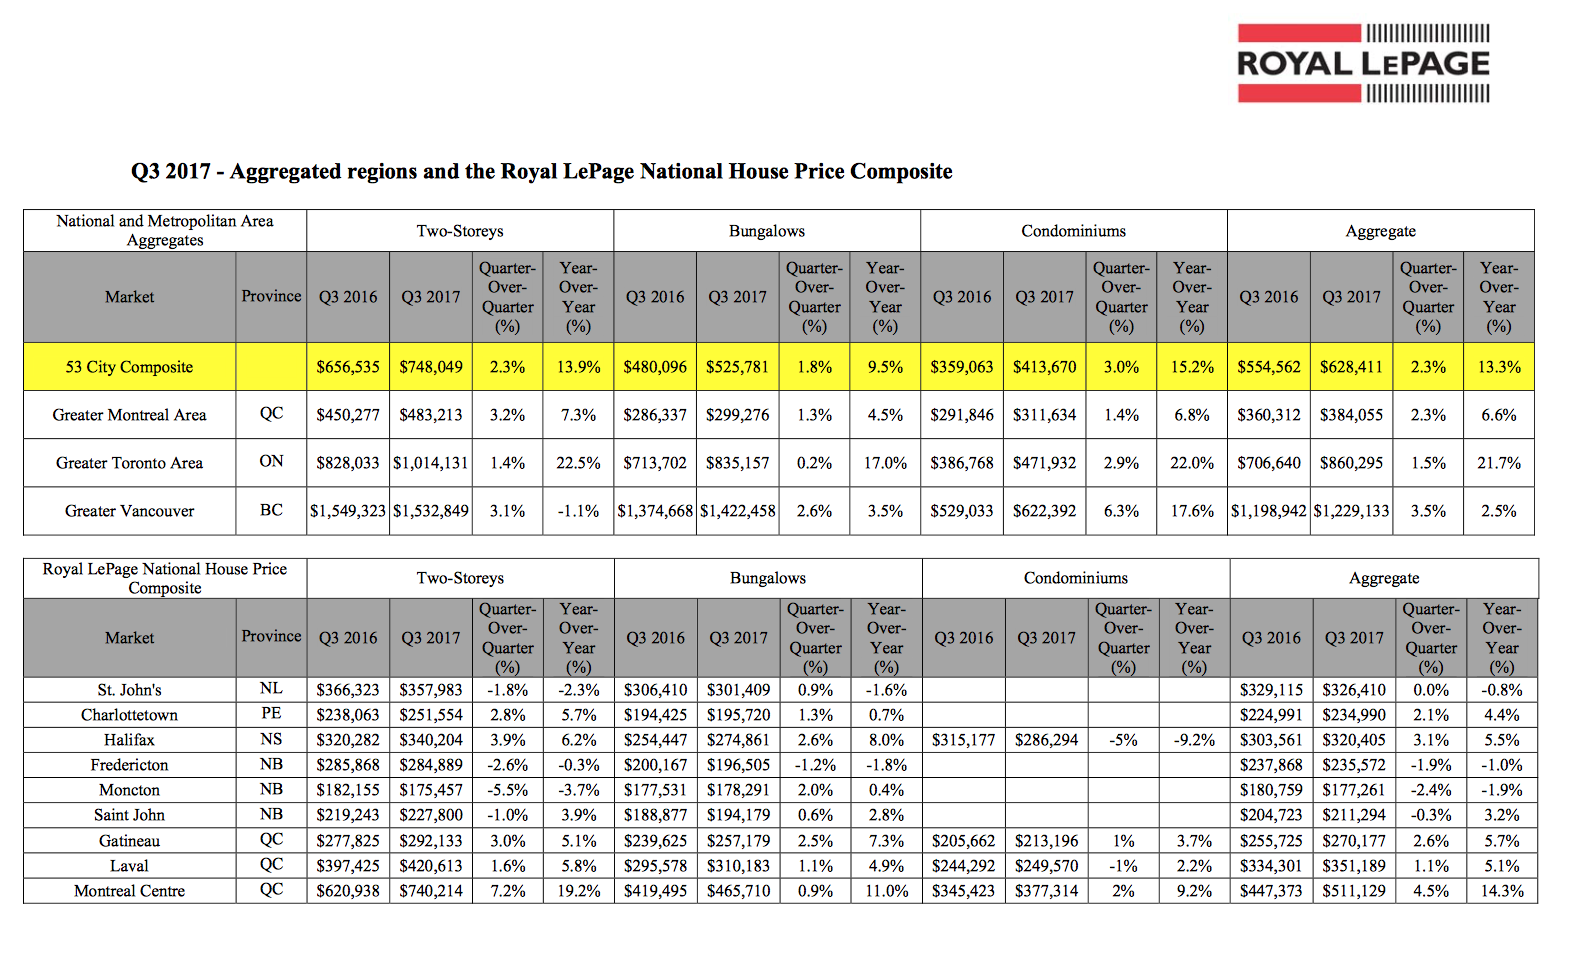
The Royal LePage National House Price Composite, compiled from proprietary property data in 53 of the nation’s largest real estate markets, showed that the price of a home in Canada increased 13.3 per cent year-over-year to $628,411 in the third quarter. When broken out by housing type, the median price of a standard two-storey home rose 13.9 per cent year-over-year to $748,049, and the median price of a bungalow grew 9.5 per cent to $525,781. During the same period, the median price of a condominium rose 15.2 per cent to $413,670.

“Uneven regional economic growth has plagued Canada for much of the past decade, a challenge most evident in the nation’s housing markets,” said Phil Soper, President and CEO, Royal LePage. “For the first time since 2011, we are seeing real estate in all five of our largest cities appreciate at a manageable, healthy clip. Canadian housing is enjoying a Goldilocks moment – not too hot, and not too cold.”

“For now, the Toronto and Vancouver housing markets have returned to earth,” continued Soper. “After a period of unsustainable price inflation and sharp market corrections, we are seeing low single digit appreciation in each. Calgary has shaken off the oil-bust blues and Montreal appears to be at the beginning of a new era of economic prosperity. Rounding out the ‘big five,’ the Ottawa market is behaving like it usually does – a picture of healthy market growth.”

“Marginally higher borrowing costs should dampen domestic demand somewhat, and with less currency-adjusted purchasing power, foreign buyer activity is off peak levels and will likely stay that way in the near-term,” added Soper.

During the third quarter, the Greater Toronto Area saw the largest year-over-year home price increase of any major Canadian market, surging 21.7 per cent on the back of strong gains witnessed at the beginning of 2017. Meanwhile, home prices in Montreal continued to climb at a rate beyond what has been the historical norm, appreciating by 14.3 per cent when compared to the same time last year, while Ottawa grew by 7.9 per cent over the same period. When looking at the largest markets in Canada’s westernmost provinces, Calgary and Greater Vancouver inched further out of their recovery, with home prices rising 5.0 and 2.5 per cent year-over-year, respectively.

Following a very similar trend to the Vancouver housing correction of 2016, the Greater Toronto Area market experienced a sharp drop in sales volumes beginning in April 2017, which continued through much of the third quarter. With underlying employment and economic growth on solid footing, the Toronto market began to grow again in August.

Potential buyers who were previously on the sidelines taking a wait-and-see approach have now jumped back into the market after realizing prices did not drop as certain market watchers had anticipated. On the supply side, some sellers who had attempted to capitalize on an uncharacteristically strong spring have taken their homes off the market. Together, these trends have caused the region to revert to a more balanced market where supply and demand have stabilized in the majority of areas.

Nationally, condominium prices increased 15.2 per cent on a year-over-year basis and have begun to appreciate faster than any other housing segment in large urban centres such as Toronto and Vancouver. This is likely to continue for the foreseeable future and begin a trend in other cities. The overall affordability of condominiums continues to attract first-time homebuyers and purchasers looking for attractively-priced real estate as new mortgage regulations, interest rate increases and higher home prices have effectively limited purchasing power.

Under the Ontario Fair Housing Plan, all private rental units in the province are now subject to rent control, and housing market watchers have a number of concerns regarding the impact of this legislation. Removing the ability to adjust prices by more than 2.5 per cent a year when long-term residential real estate price appreciation is approximately 5.0 per cent per year makes rental units less attractive to investors. It is likely fewer purpose-built rental projects will be launched in the near future. According to one industry report, more than 1,000 such projects have already been cancelled and vacancies have already fallen to 1.3 per cent across the GTA[2].

“Ontarians deciding between renting and buying a home are facing two tough options,” said Soper. “Purchasers trying to break into the entry-level market now face a highly competitive environment, while those waiting to buy are met with high rental prices brought on by a significant shortage of inventory.”

“There may be unintended consequences to new province-wide rent controls,” concluded Soper. “We need more family-sized units in the province’s cities; apartments with two or three bedrooms. Yet purpose-built rental projects are likely to focus on smaller bachelor or one-bedroom units, which tend to attract shorter-term tenants. The higher turn-over allows landlords to raise rates more frequently. This will put further upward pressure on the price of existing family-sized rental units.”

Full article link here.

Provincial and City Summaries and Trends

Screen Shot 2017-10-16 at 11.25.31 AM.png
Screen Shot 2017-10-16 at 5.16.53 PM.png
Screen Shot 2017-10-16 at 5.17.14 PM.png

For more information visit: www.royallepage.ca

[1] Aggregate prices are calculated using a weighted average of the median values of all housing types collected. Data is provided by RPS Real Property Solutions.

[2] Urbanation Inc. report prepared for the Federation of Rental-housing Providers of Ontario, “Ontario Rental Market Study: Measuring the Supply Gap,” September 2017

If you are curious to know how much your property is worth today, please feel free to reach out, and if you found this article helpful please hit "Like" and "Share".


Comment

More Inventory Starting to Attract More Buyers

Comment

More Inventory Starting to Attract More Buyers

IT LOOKS LIKE THE WORST IS OVER FOR THE TORONTO HOUSING CORRECTION

Last month I spoke about how the Greater Toronto Area Real Estate Market is beginning to change shape and return to balance. Well, the evidence is in, as the number of new listings entered into The Toronto Real Estate Board’s MLS® System amounted to 16,469 in September – up by 9.4 per cent year-over-year.  But the real story is that total active listings stood at 19,021, a whopping 69% increase year-over-year.  TREB suggests that the improvement in listings in September compared to a year earlier is a sign that home owners are anticipating an uptick in sales activity as we move through the fall, or put another way, more inventory is starting to attract more buyers back to the market.

TREB announced that Greater Toronto Area REALTORS® reported 6,379 sales through TREB’s MLS® System in September, roughly the same amount as in August, but 35 per cent lower than September of last year.  In a balanced market, buyers take longer to make up their minds, as there is more product available to choose from.  Likewise, sellers need time to get adjusted to the new market reality.  Remember, the last few years were anything but “ordinary”.

Think of it this way.  Last year at this time, inventory (the number of active listings on MLS®) stood at approximately one month of sales.  So, on average, every home on the market was selling within a month or less, with multiple offers driving up the price paid due to the scarcity of supply.  Now that inventory is closer to 3 months supply, what this means is that 1 out of every 3 houses on average is selling within the month, and price is no longer being dictated by the frenzy we saw when homes were in such short supply.  So it makes sense to see that sales are about a third lower in September 2017 than they were in September of last year.  All of this is happening against a backdrop where average prices are still increasing, albeit at a lower rate than we saw during the run up.  The average selling price of a home in the GTA in September 2017 was $775,546 – up 2.6 per cent compared to September 2016.

However, the exception continues to be the condominium apartment market segment, where average prices were up on average by 23 per cent compared to last year. TREB reported in September that “tighter market conditions for condominium apartments follows consumer polling results from the spring that pointed toward a shift to condos in terms of buyer intentions”. In fact, condos accounted for almost 30 per cent of all MLS home sales across the GTA during the month of September, whereas detached homes – the most expensive market segment on average - accounted for a smaller share of overall transactions this year compared to last.

If you are curious to know how much your property is worth today, please feel free to reach out and if you found this article helpful please hit "Like" and "Share".


Comment

2017 INVICTUS GAMES, TORONTO

Comment

2017 INVICTUS GAMES, TORONTO

2017 INVICTUS GAMES, TORONTO HIGH PARK

THEY ARE UNCONQUERED!

The word “Invictus” means “unconquered”.  It embodies the fighting spirit of these “warriors” and what they can achieve through their tenacity post-injury. The Games are about much more than just sport. Invictus captures hearts, challenges minds and changes lives. The motto for the games is "I am".

The Invictus Games are Prince Harry’s sporting event for the wounded, injured and sick servicemen and women.  Perhaps you’ve seen His Royal Highness on the news this week. On Wednesday he was right in our own backyard - in High Park - to give out medals to the athletes!

Once again, we are so fortunate to live in such a great city! If you have a chance this week get out there and cheer these courageous people on and join the movement, started by Prince Harry in 2014, to help generate a wider understanding and respect for those who have sacrificed so much to serve their country and their people.

Enjoy!

If you liked this post, please hit like and share.

Luba, xo


Comment

A SEPTEMBER TO REMEMBER!

Comment

A SEPTEMBER TO REMEMBER!

2017 TERRY FOX RUN WAS A HUGE SUCCESS

HIGH PARK, SEPTEMBER 17, 2017


From the bottom of my heart, I want to thank you for your participation! I know you all lead busy lives but yet you took the time to make a difference and it means the world to me. Our goal this year was to raise $15,000 towards this worthy cause and we surpassed our expectations.

Terry_Fox_Run_High_Park.jpg

As a Team, this year we raised $17,423 and the donations are still coming.

The High Park Run raised $109,130

The Terry Fox Run as a whole raised $3,675,624 this year and counting..

To date LUBA BELEY TEAM raised $75,544.

Thanks to your generosity, cancer research in Canada continues to forge discoveries that Terry could only have dreamed about. None of this would be possible without you. 

WE LOVE TERRY!

Terry Fox is truly my Canadian hero who so positively touched lives of so many people. Terry was only 18 when doctors amputated his right leg 15 cm above the knee and not long after losing his leg to cancer, Fox decided to run across Canada to raise awareness and money for cancer research. He ran from St. John’s, Newfoundland, to Thunder Bay, Ontario, covering 5,373 km in 143 days, but was forced to halt his Marathon of Hope when cancer invaded his lungs. He died shortly before his 23rd birthday.

The courage and determination of this young man have inspired millions of people around the world and we are so proud and happy to keep embracing Terry's legacy.
In 1981, Terry said, "Even if I don't finish, we need others to continue. It's got to keep going without me." Every day we are moving closer to his inspiring dream: a world free of cancer.

THANK YOU FOR YOUR DONATION & YOUR PARTICIPATION!

Here are some photos from our 2016 & 2017 High Park Terry Fox Run


TORONTO UKRAINIAN FESTIVAL

BLOOR WEST VILLAGE

SEPTEMBER 15 - 17, 2017

IMG_0001.jpg

Did you know that Toronto Ukrainian Festival was celebrating its 21st year in the Bloor West Village this year? Today it is the largest Ukrainian Festival in North America.

The Festival's organizers describe its vision "Is to offer the largest celebration of Ukrainian spirit in the world – showcasing the best of Ukrainian arts and culture and thereby strengthening the multicultural fabric of Canada. The Festival takes pride in turning its spotlight on contemporary professional and amateur artists and performers from North America and Ukraine, and in celebration of Toronto’s diversity, invites a local performing group representing another culture to bring its talents to the main stage each year. Throughout its history, the Festival has hosted prime ministers and other politicians from all levels of government." 

And we are so lucky that it all happens in our backyard.

In the last 21 years, I don't think I ever missed one. In previous years I participated in the Festival at a different capacity. This year I decided to showcase my real estate business by hosting an information booth.

It provided me with an excellent opportunity to reconnect with so many of my fellow Ukrainians, as well as meeting people from the Bloor West Village neighbourhood, neighbourhoods across the GTA and visitors from around the world. 

Visitors to my booth had an opportunity to be photographed in traditional Ukrainian costume,  and enter into a draw for a chance to WIN a $200.00 pre-paid Visa card. I would like to thank each end every one of you who stopped by to say hi and greeted me so ever warmly.

This was great fun, and once again I truly appreciate your continued loyalty and support.

For more information, please visit the 2017 Toronto Ukrainian Festival website here.

Comment