Viewing entries in
HOME IMPROVEMENTS

May Market Report - Steady Price Growth in the GTA Housing Market

Comment

May Market Report - Steady Price Growth in the GTA Housing Market

In May, we saw a continuation of the steady price growth experienced in the Greater Toronto Area (GTA) housing market during the 4 previous months.  So far, in the first 5 months of 2018, average home prices in the GTA have increased by 9.6%, to $805,320.  Unit sales have also increased each month in 2018 - from 4,019 units in January, to 7,834 units in May.

As I mentioned in last month’s blog, the housing market conditions in 2018 are very different than the conditions experienced during the comparative period in 2017.  But beginning in May, and through the second half of 2018, the comparisons will become more meaningful, as May, 2017 was the first month last year when the impact of the foreign buyers tax began to effect a slowdown in the rate of price growth and market activity, following the frenzy in the months prior when prices were bid up to unreasonable levels due to short supply and speculation.  So for the first time, we have the impact of the foreign buyers tax in both monthly results year-over-year, which makes a May to May comparison a little more relevant.

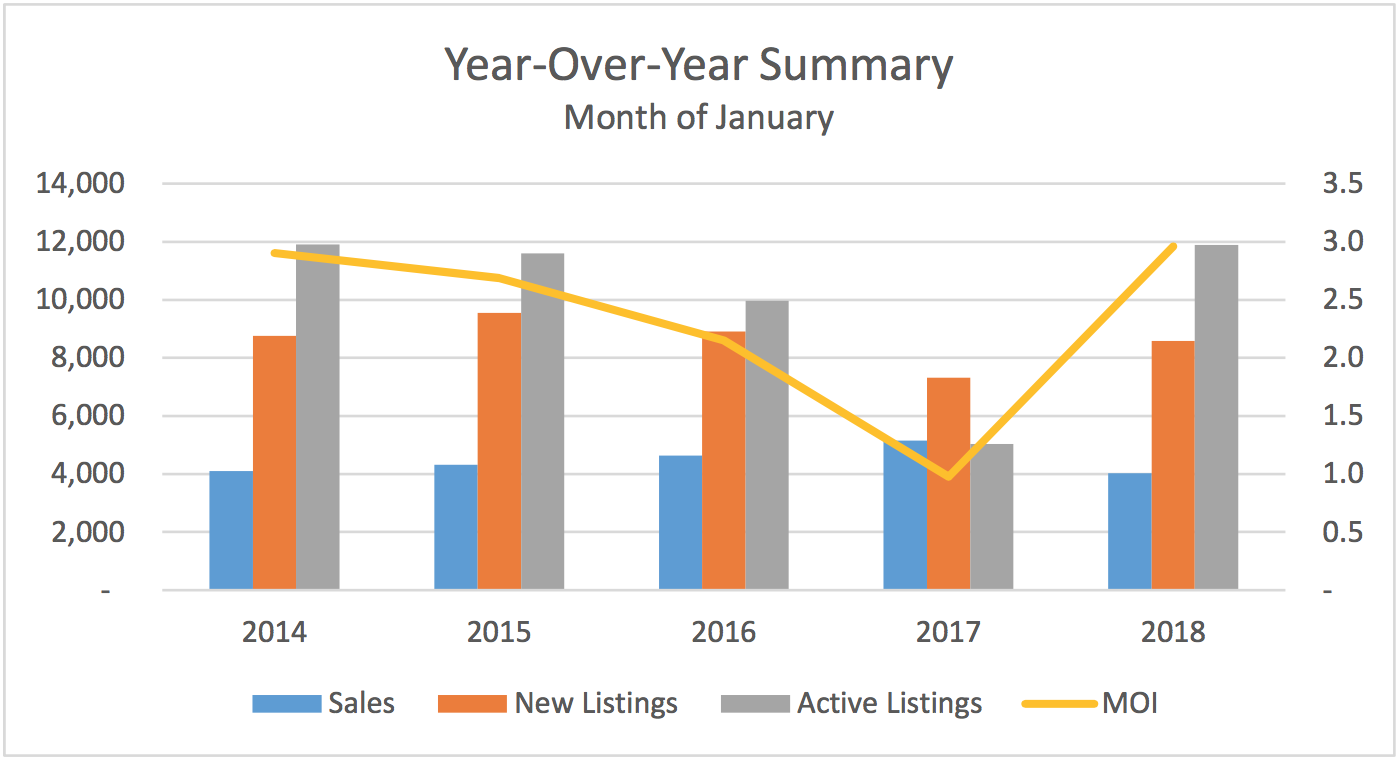
It is interesting to note, therefore, that new listings were down by more than sales this May compared to last year, (26.2% versus 22.2%), meaning that competition heated up among buyers.  And there are indications from sellers that listing intentions are down significantly since the Fall, meaning the supply of homes available for sale could continue to be an issue in the latter half of 2018.  And when the supply of homes decreases, prices increase, as competition among buyers intensifies.

This is particularly true in the City of Toronto (416) where, for example, average selling prices were at or above average listing prices for all major home types in May.  What is even more interesting, is that the further out you travel from Downtown Toronto, the weaker the market gets.  And since the GTA housing numbers are an average over the entire 416 and 905 regions, this proves how strong the market is right now in the City of Toronto, compared to the rest of the GTA, as the following chart shows:

Screen Shot 2018-06-14 at 4.14.17 PM.png

Finally, these last two charts highlight the composition of the May sales by home type in each of the 416 and 905 sub markets.  In the 416 region, condominiums accounted for a commanding 57% of unit sales and detached homes made up 25%, while in the 905 region it was detached homes that accounted for the majority of unit sales, at 55% of the total.  What these charts clearly indicate is that condominiums are the dominant force driving unit sales in the 416 region and are in high demand compared to higher priced detached homes, while the opposite is true in the 905 region where the inventory of detached homes tends to be more prevalent and buyers have more choice, which means these homes take longer on average to sell.

If you would like to find out what these statistics mean to you, or if you are curious to know how much your property is worth today or how much you can afford to buy, please reach out. 

If you found this article helpful please hit "Like" and "Share".

Comment

Turning your single-family home into income generating property

Comment

Turning your single-family home into income generating property

Let's take a look at turning your single-family home into a two-family, income generating property. This strategy can be an attractive alternative for empty-nesters and retirees who’d prefer not to move – and who’d be happy to generate some extra income.

At some point, usually after the children have moved out, many home owners decide to downsize. Today, that usually means moving into a condo or to a smaller community.

But many couples would prefer to stay in the family home, continuing to enjoy the neighbourhood they know so well. Here’s an alternative for anyone considering their options in such a situation.

Why not re-configure your home into a two-family, income-generating property? This strategy has a number of advantages.

  • You get to stay in the home and the neighbourhood you love

  • You can avoid many of stressors involved in adapting to a new neighbourhood, new neighbours, and unfamiliar amenities and services.

  • You end up with less home to manage.

  • You can generate important extra income to help fund your retirement years and lifestyle enhancements.

  • You may significantly increase your property’s value when it’s reclassified as an income property.

Offsetting these advantages, you’ll have to deal with some challenging realties:

  • Living through the renovation process, likely four months to a year. During this period, you might have to find a temporary residence.

  • Financing the renovations.

  • Managing the renovation process to be sure it meets your expectations and stays within budget.

  • Living alongside tenants who may not share your lifestyle.

  • Assuming the role of “property manager” – this means, at a minimum, dealing with occupancy, rent collection and maintenance issues.

P6180314.jpg

Should you decide to re-configure your home to generate an income, here’s an ACTION PLAN to get the process underway.

Zoning and Permits

First, you’ll need to check out zoning issues. Is your area zoned for the living arrangement you’re hoping to create? Do you need to apply for rezoning or get a zoning restriction waiver?

Requirements vary from region to region, although there are some basics that will apply almost anywhere – each residence will need at least one exit of its own, plus bedroom, bathroom and kitchen area, and perhaps separate utilities and meters. 

Other safety standards, such as fire codes, might change once you turn the space into a two-family dwelling – such information is available from your local building planning department.

Space planning

You’ll need to consider what kind of people you want to occupy the new space – a family, students, another retired couple? This will affect the number of rooms and their sizes, the design of kitchen and bathroom spaces, and other considerations. 

If you need or want to make big changes, consult with a structural engineer. This is the time to think about major issues like the building’s envelope, and to fix any deficiencies or reconfigure the roof, walls, windows or doors.

Determine the rental income you can expect

Contact a real estate agent you trust to determine the rental income you can expect to earn, taking into consideration periods when the unit is vacant. As part of this analysis, find out how this revenue will be taxed, and what portion can be offset as expenses when you file.

Financing

You may need to take out a home improvement loan, a business loan, or even a second mortgage. Prospective lenders will need to factor in a number of elements: the use of second unit, your credit rating, etc. Ask your real estate agent to provide you with a home valuation before beginning.

Retain an architect

To be sure your re-configured property is in compliance with local zoning, building codes and safety regulations, retain an architect with local knowledge and expertise in handling this type of project. Be sure to get at least two or preferably three quotes.

Recruit a construction company

Be sure the company is experienced in this kind of project. Get at least three quotes. Have the company you select meet with the architect to work out potential issues before the construction process begins. 

Have qualified back-up in place to help keep the project on track. It’s always a good idea to have someone who cares for you to act as your back-up or to offer support as you go through the renovation process. Maybe one of your grown children, or a close friend.

Should you wish to explore this alternative to downsizing, I’d be pleased to help you assess this opportunity in respect to your specific home.

If you found this article helpful please hit "Like" and "Share".

Comment

April Market Report  |  Which Headline Tells the True Story?

Comment

April Market Report | Which Headline Tells the True Story?

Average Selling Price for Homes in the GTA up 9.2% Year to Date, OR

Average Selling Price for Homes in the GTA down 12.4% in April Year-Over-Year?

Well, both are true actually.  But which one is more relevant?

I believe the first headline is more relevant, because it tells us what is happening in the current real estate market.  We already know that the GTA real estate market reset from its historical highs (in April, 2017 the GTA recorded the highest ever average selling price) after the introduction last year of the foreign buyers tax in Q2, followed by the more restrictive mortgage qualification rules introduced at the beginning of 2018.  Add to those measures the 2 successive increases in interest rates by the Bank of Canada and the market cooled down considerably.

Headlines are meant to grab the reader’s attention.  And one could argue that negative headlines tend to attract more attention than positive ones.  But the facts are that the GTA real estate market is trending positive, despite being off its historical highs.  Take a look at these statistics for the first 4 months of 2018:

Screen Shot 2018-05-08 at 2.03.08 PM.png

Unit Sales and Active Listings have increased in each month.  Average selling price is up 9.2% in four months.  Days on the Market have gone down by more than a third, and Average Selling Price to List Price is stable.  These are all signs of a healthy real estate market.

But the GTA real estate market is really a tale of 2 cities.  As reported by TREB in their latest Market Watch:

“The year-over-year change in the overall average selling price has been impacted by both changes in market conditions as well as changes in the type and price point of homes being purchased.  This is especially clear at the higher end of the market.  Detached home sales for $2 million or more accounted for 5.5% of total detached sales in April 2018, versus 10 per cent in April 2017.”

The differences in the composition of the current GTA real estate market can seen by looking at the following statistics broken down by major home type:

Screen Shot 2018-05-08 at 2.02.42 PM.png

There is roughly a 3 month supply of detached homes for sale in the GTA, whereas there is only a 1 ½ month supply of condominium units for sale. As well,  the increase in Average Selling Price for Condominiums, at 10.2% for the first four months of 2018, is outpacing the rate of increase for Detached homes, at 6.1%, as there is obvious pressure at the lower end with Condominiums in short supply.  TREB expects that “once we are past the current policy-based volatility, home owners should expect to see the resumption of a moderate and sustained pace of price growth in line with a strong local economy and steady population growth”.

If you would like to find out what these statistics mean to you, or if you are curious to know how much your property is worth today or how much you can afford to buy, please reach out.

If you found this article helpful please hit "Like" and "Share".

Comment

GTA March Housing Stats – a stark contrast from 2017

1 Comment

GTA March Housing Stats – a stark contrast from 2017

Toronto Real Estate Board Director of Market Analysis Jason Mercer perhaps sums up the Q1-2018 Greater Toronto Area housing market best:

“Right now, when we are comparing home prices, we are comparing two starkly different periods of time: last year, when we had less than a month of inventory versus this year with inventory levels ranging between two and three months.  It makes sense that we haven’t seen prices climb back to last year’s peak.  However, in the second half of the year, expect to see the annual rate of price growth improve compared to Q1 as sales increase relative to the below-average level of listings.”

Now look at this chart, which shows those two “starkly different periods of time”.   What the chart shows is the huge run up in prices in the first half of 2017, followed by a reality check, as prices declined rapidly in Q3, after the introduction of government measures to cool the market.  Prices rebounded somewhat in Q4, as some buyers and sellers accelerated their property ownership decisions prior to the introduction of the more stringent lending guidelines which came into effect in January, 2018.  And now, we are back to some period of relative normalcy, with modest price appreciation in Q1-2018.

So it doesn’t really matter that units sales were down by almost 40%, from 11,954 units in March, 2017 to 7,228 units in March, 2018, or that prices were down on average by 14.3%, from $915,126 to $784,558 because these results cover two starkly different periods of time, and are, therefore, not comparable.

What is meaningful, however, is that the number of active listings in March, 2018 was 103% higher than the level in March, 2017 and that the average time it took to sell a home in March, 2018, at 20 days, was roughly the same amount of time it took back before the market went crazy in Q1-2017, when the average time it took to sell a home in the GTA was below 10 days.  And the average selling price has actually increased in each of the last 3 months.  I’ve said it before and it bears repeating that we are in a balanced market, one which TREB believes is poised for stronger growth later in 2018, particularly in the condominium market where prices have been steadily on the rise and inventories have become ever more scarce.

If you are curious to know how much your property is worth today or how much you can afford to buy, please feel free to reach out; and if you found this article helpful please hit "Like" and "Share".

1 Comment

What’s the difference between an Agent, Salesperson, Broker and a REALTOR®?

Comment

What’s the difference between an Agent, Salesperson, Broker and a REALTOR®?

You’ve heard many terms when referring to people who sell real estate. What’s the difference between an Agent, Salesperson, Broker and a REALTOR®?

Yes, the terminology can be confusing. While it may not seem important to know the difference between these terms, there are some common traits and useful distinctions to be aware of when you look to buy or sell a home.

Let’s start with the most commonly misused term, “agent”. While most people would use that term to describe the individual real estate professional assisting them, that’s not technically correct; legally, “Agent” is actually the term given to the brokerage (the company) that represents you as the buyer or seller. An agency relationship is formalized when you sign a contract either in the form of a buyer representation agreement or a typical listing agreement. These are between buyer/seller and the brokerage, not the individual representative.

A real estate salesperson or broker will be the person who presents and explains the representation agreement to you on behalf of the brokerage. In most cases, they will also usually be the same person who represents you during the buying or selling process, on behalf of the brokerage.

Salespeople and brokers are both real estate professionals who are subject to regulation under the Real Estate and Business Brokers Act, 2002. They must be employed by a real estate brokerage and must be registered with RECO (Real Estate Counsel of Ontario) in order to trade in real estate in Ontario. More info at RECO.on.ca

Education is what distinguishes a broker from a salesperson. A salesperson achieves the broker designation by successfully completing the Broker Registration Education Program. This course will provides an overview of how to establish, operate, and manage a real estate brokerage. More info at OREA.com

What's the definition of a REALTOR®? REALTOR®, REALTORS® and the REALTOR® logo are certification marks owned by REALTOR® Canada Inc., a corporation jointly owned by the National Association of REALTORS® and CREA.

Not all real estate agents are REALTORS®.

The REALTOR® trademarks are used to identify real estate services provided by brokers and salespersons who are members of CREA and who accept and respect a strict Code of Ethics, and are required to meet consistent professional standards of business practice which is the consumer’s assurance of integrity. More info at CREA.ca

If you found this article helpful, please hit "Like" and "Share"! 

Comment

How do the Month of February Results Compare to the Long-term Trends in the GTA Housing Market?

Comment

How do the Month of February Results Compare to the Long-term Trends in the GTA Housing Market?

The Toronto Real Estate Board (TREB) released its February Stats on March 6, announcing that Greater Toronto Area REALTORS® reported 5175 residential transactions through TREB’s MLS® System in February 2018.  This result was down by 34.9% compared to a record 7,955 sales reported in February, 2017.  The overall selling price fell by 12.4% year-over-year to $767,818 from $876,336.  But remember, prices spiked in the first quarter of 2017.  If you put that aside and compare this result to February 2016, you will note that prices in February 2018 remained 12% higher than the average reported for February 2016, and that represents an annualized increase which is well above the inflation rate for the past 2 years.

Active listings increased by 147.4%, from 5,400 a year earlier to 13,362 in February 2018, accounting for an increase in inventory levels to roughly 2.6 months of supply in 2018, from the unhealthy 0.7 ratio seen last February.

Last month I presented some charts showing what was going on in the market on a micro basis, compared to the past 5 years.  This month, I’m digging deeper, going back 10 years, but on a more macro level.  The solid horizontal line in each of the following charts shows the 10-year average value for the metric being measured.  And, except unit sales for the month of February 2018, which were off significantly from their 10-year average, the charts present a pretty clear picture that February 2018 produced results that were very close to historical averages for that month.

Screen Shot 2018-03-09 at 7.06.36 PM.png

In fact, average overall prices in February, 2018 were just slightly off their 10-year trend average growth rate (green line below), mostly because the abnormally high run-up in prices in 2017 that was caused by demand-supply imbalances, (particularly in single family detached homes) pushed the trend line upwards.  Another interesting observation is that although February 2018 prices on average were down by 12.4% when compared to February 2017, condominium prices (the blue column in the chart below) continued their upward trend, increasing by another 10.1% over their February 2017 record level.  And condominium prices are now trending above their 10-year average growth (blue line below).

Luba Beley Market Report

This next chart shows that the market is a more balanced one in February 2018 than it was in either February 2016 (when inventory of homes for sale was extremely low at just over 1.5 months of supply) or February 2017 (when inventory was almost non-existent).  Inventory compared favourably in February 2018, at 2.6 MOI, to the historical average of 2.4 months of supply.

Screen Shot 2018-03-09 at 7.05.09 PM.png

Lastly, a comment on interest rates – the Bank of Canada decided not to increase its benchmark interest rate this month from its current level of 1.25%, adopting a cautiously negative tone about the growing uncertainty for the global and Canadian outlooks as a result of the U.S. trade policy which is edging towards more protectionism and higher tariffs.  Home buyers can breathe a sigh of relief (however brief) that interest rates will likely remain at their current levels for at least another quarter.

If you are curious to know how much your property is worth today or how much you can afford to buy, please feel free to reach out; and if you found this article helpful please hit "Like" and "Share".

Comment

March Market Report - Pictures Say It All

March Market Report - Pictures Say It All

The market has returned to a more balanced one, reflecting the same characteristics as it did back in January 2014 and here is why.

The Toronto Real Estate Board (TREB) released its January Stats on February 6, announcing that Greater Toronto Area REALTORS® reported 4,019 residential transactions through TREB’s MLS® System in January 2018.  This result was down by 22% compared to a record 5,155 sales reported in January, 2017.  The overall selling price fell by 4.1% year-over-year to $736,783 from $768,351, with the decline being weighted toward the detached segment of the market, continuing the trend seen in the latter half of 2017.  Active listings increased by 136.3%, from 5,034 a year earlier to 11,894 in January 2018, accounting for an increase in inventory levels to roughly 3.0 months of supply in 2018, from the unhealthy 1.0 ratio seen last January.

Now I want to show you some pictures that put these statistics into historical perspective.  And the results may surprise!  January home sales increased by roughly 1,000 units from 4,103 units in 2014 to 5,155 units in 2017, then decreased in 2018 back to the 2014 level.  What is interesting, however, is that the mix of sales by major home type during the 4-year period saw the share of condominiums as a percent of total unit sales rise by 5.4%, from 26.7% of the total in 2014 to 32.1% in 2018, while the share of higher priced detached and semi-detached homes decreased by 5.4%, from 46.2% of the total to 41.8%.  The shift was most dramatic from 2017 to 2018, as affordability became a major issue, particularly for first time home buyers who have flooded the condominium market.

Screen Shot 2018-02-08 at 10.25.29 AM.png

After a period of declining interest rates, it appears that the recent Bank of Canada increases are setting the stage for further interest rate increases on the horizon.  But interest rates today are essentially the same as they were in January 2014.

Interest rates Luba Beley

The market has surely returned to a more balanced one, reflecting the same characteristics as it did back in January 2014, when the inventory of homes (MOI) stood at roughly 3 months of supply, indicating that on average a home took 3 months to sell in 2014, exactly the same amount of time as it would in 2018, but a far cry from January 2017 when the inventory of homes was at an historically low of 1 month supply.

Year-Over-Year Summary/ Luba Beley

Lastly, although prices were down on average by 4.1% year-over-year this January, they are still up a cumulative 49.3% - from $526,965 in 2014 to $736,783 in 2018 - for the average home sold in the GTA.  Interestingly, the average annual price increase for detached homes in the 4-year period was 9.0% per year, compared to the average annual price increase for condominiums of 10.0% per year, but with lower priced condominiums making up a larger share of the total unit sales in 2018 than they did in 2014, this brought the overall annual increase in prices down to 8.7% per year on average for all housing types during the 4-year period.

Average price by major home type/ Luba Beley

If you are curious to know how much your property is worth today or how much you can afford to buy, please feel free to reach out; and if you found this article helpful please hit "Like" and "Share".


Signals of a Healthy GTA Real Estate Market Continue

Comment

Signals of a Healthy GTA Real Estate Market Continue

There were a total of 7,118 residential sales reported through TREB’s MLS system in October, compared to 9,715 transactions a year ago.  Even though the number of transactions was down by 26.7% year-over-year, the jump of almost 12% in residential sales reported between the months of September and October in 2017 was more pronounced than usual compared to the last 10 years, a clear signal that market momentum is picking up.

Active listings were 78.5% higher than a year ago, an indication that supply and demand are continuing to balance out as inventories settled at 2.6 months of supply in October, down marginally from the 3.0 months of supply in September, but still much healthier than the scant 1.1 months of supply experienced in October, 2016.  There is, however, a continuing lack of quality listings in core GTA neighbourhoods and there are early indications that offer dates are reappearing as homes are being underpriced to generate bidding wars, although this has yet to manifest in the overall selling price to list price ratio which is currently holding at 98%.

While the average selling price for October transactions was $780,104 – up by 2.3% compared to the average of $762,691 in October 2016 -  the continuing low supply of, and high demand for, condominiums fuelled a 21.8% increase in prices in that segment of the market.

Expectations are that market activity will pick up further in the next 6-8 weeks as buyers rush to obtain mortgage pre-approvals and submit offers before the new stress tests announced by OSFI last month are implemented at the beginning of 2018, further reducing buying power as the pre-qualification hurdle rate increases to the higher of the 5-year benchmark rate published by the Bank of Canada or your negotiated contract borrowing rate + 2%.

Do you remember the story of Goldilocks and the Three Bears?  When Goldilocks arrived at the bears’ house in the forest there were three bowls of porridge on the table and she was hungry. The first bowl of porridge she tried was “too hot”, the next one was “too cold”, but the third one was “just right”.  Well, this just might be a “Goldilocks” moment in the GTA housing market!

If you are curious to know how much your property is worth today or how much you can afford to buy, please feel free to reach out; and if you found this article helpful please hit "Like" and "Share".


Comment

Renting or Buying? New Regulations Are Making Affordability More Difficult

Comment

Renting or Buying? New Regulations Are Making Affordability More Difficult

Beginning January 1, 2018, if you are buying a home, even if you have equity of 20% or more, a new regulation announced this week by OSFI (the Ontario Superintendent of Financial Institutions) could make it more difficult for you to qualify for a mortgage.

The revised Residential Mortgage Underwriting Practices and Procedures include several key changes that the regulator says is part of its expectation that federally-regulated mortgage lenders remain vigilant in their underwriting practices, the most significant of which is a new “stress test”.

One fear hitting the headlines today is that the impacted borrowers will turn to unregulated lenders including credit unions and caisses populaires, which are not subject to the new rules.

 If you stay with the same institution, banking competition will be even further restricted as those renewing mortgages will not have the ability to shop around. Great for the banks!

In order to qualify for an uninsured mortgage the minimum qualifying rate for uninsured mortgages will be the greater of the five-year benchmark rate published by the Bank of Canada or the contractual mortgage rate +2%.  So if the Bank of Canada five-year rate is 5% and you are able to negotiate a lower rate from your financial institution – say 3.5%, then the stress test will mean that you would otherwise have to qualify for a 5.5% rate mortgage in order to be approved.  Alternatively, if you were only able to negotiate a 50 basis point reduction from the posted rate, or 4.5%, then you would have to show that you would qualify for a 6.5% rate mortgage of the same amount.  What this will likely mean for most borrowers, is that they will not be able to afford the home that they thought they could before the change in regulations.

For example, as reported by TREB (The Toronto Real Estate Board) the average price of a semi-detached home in the GTA in September, 2017 was $752,379.  A buyer with a 20% down payment would need a mortgage of approximately $600,000 in order to purchase this “average” home.  Let’s say that the Bank of Canada five-year benchmark rate is 5.0% and that this purchaser was able to negotiate a rate of 4% with their financial institution.  Therefore, the purchaser would have to demonstrate that they could afford the payments on a 6% mortgage of this amount (roughly an additional $350.00 per month or $4,200.00 per year on a monthly pay mortgage amortized over 25 years), otherwise they would only qualify for a smaller mortgage.  If they could not come up with that extra income to show that they would qualify for a $600,000 mortgage under the new regulation, then they would have to settle for a mortgage of $545,000, meaning that with their $150,000 down payment they could only afford a home priced around $695,000, or roughly 8% less than the price of the average semi-detached home selling currently in the GTA.

So for many, the alternative will be to look for a smaller home to purchase, perhaps a less expensive condominium, rent or move out of the city.  And sadly, the news does not get much better with those alternatives, due to the shortages of available units in both the sales and rental markets for condominiums.  And affordability is becoming a real issue as the focus of buyers and renters alike has shifted to condominiums, bidding up prices both for units for sale and units for rent.

Urbanation just released its analysis of this year’s third quarter and found condo rents averaged $2,219 a month for units averaging 743 square feet – a $232 year-over-year increase. It also found that newly signed leases in the third quarter, at 7,761, hadn’t much changed in a year.

A new report commissioned by the Federation of Rental-Housing Providers of Ontario says the Liberal government’s Fair Housing Plan has negatively impacted the province’s rental housing supply. Before the introduction of the government legislation, 28,000 rental units were in the planning pipeline, but since the new rules were introduced 1,000 of those units have been cancelled or converted to condominiums. The report estimates that if 6,250 new rental units are not built per year in Ontario supply will continue to drop and naturally drive the demand up and the prices.

A lot of factors have conspired to put relentless pressure on the rental market – the astronomical cost of homeownership, stricter mortgage qualifications, high migration and the Fair Housing Plan, among others – but none has been more pronounced than the supply shortage.  Moreover, the reintroduction of rent control has provided tenants increased incentive to remain in their dwellings, stunting the turnover rate.

Tim Hudak, CEO of OREA (The Ontario Real Estate Association) recently had this to say about the latest regulation. “It’s time for governments to hit the brakes on more demand side policy interventions and take a wait and see approach. Ontario’s housing market is too important to the provincial economy to move ahead with unnecessary regulation that will hurt the dream of home ownership.”

If you are curious to know how much your property is worth today or how much you can afford to buy, please feel free to reach out; and if you found this article helpful please hit "Like" and "Share".

Comment

Toronto Real Estate Market Returning to Balance

Comment

Toronto Real Estate Market Returning to Balance

After an overheated performance for much of 2016 and 2017 which saw most homes selling at sky high prices, often well over list, and with multiple offers, the Greater Toronto Area real estate market is returning to balance as the summer closes.

Don’t believe what’s in the newspapers and media reports that Toronto’s real estate market is reaching a point where the bubble is going to burst.  It’s not supported by the facts.

The Toronto Real Estate Board reports in its latest figures, for the month of August, that sales of all homes recorded on MLS across the GTA were 6,357, down 34.8% year on year and that the average price only increased 3.0% to $732,292.

However, averages don’t tell the whole story, and there are pockets of real strength, particularly condominiums, where although sales were down 28.0% (mostly due to lack of supply), prices averaged 21.4% higher across the Greater Toronto Area.

Economic indicators are also pointing to fundamental strength, with real growth in the economy up 4.5% in the second quarter of 2017 and employment growth in the Greater Toronto Area of 1.3% during the month of July.  The impact of the recent (generally expected) Bank of Canada interest rate increases have yet to play out, but it's possible that they will not have a significant lasting impact on buyer sentiment, as the extreme “heat” that was being felt in the market has cooled somewhat as it returns to a more healthy balance of supply and demand.

Also, prior to the introduction of the Ontario Government’s Foreign Buyers tax last April, housing inventories in the Greater Toronto Area were running at some of their lowest levels in history, at or below 1 month’s supply, and this was reflected in the lofty month on month price increases experienced in what was truly a “sellers” market.

With the introduction of the new tax measures in April, active listings have begun to rise while sales have tapered off.  As a result, supply of homes has increased to a more healthy balance of 2.6 month’s supply in August, although down slightly from 3.1 month’s supply in July.

Typically though, during the summer months many sellers as well as purchasers are on the sidelines and activity wanes, while people are on vacation and out enjoying the good weather.  With summer drawing to a close, there is some optimism building, now the Greater Toronto Area real estate market has returned to a more healthy balance, that activity will pick up once again in the Autumn months.

When compared with other major Canadian cities, the Greater Toronto Area still has the lowest monthly inventory of homes, well below Montreal (7.8 months), Edmonton (5.5 months) and Calgary (4.1 months), and slightly lower than Vancouver (2.9 months),  meaning the Greater Toronto Area is still the strongest housing market in Canada.

If you are curious to know how much your property is worth today, please feel free to reach out and if you found this article helpful please hit "Like" and "Share".


Comment

Hotel Mono is All Monochrome [Singapore]

Comment

Hotel Mono is All Monochrome [Singapore]

Singapore’s Hotel Mono is set in six historical shop houses in a historic Mosque Street that have undergone a modern renovation. Keeping its original elements, such as Rococo windows or characteristics airwells, the design of the hotel is clean, minimal and monochrome.

Each room is different, but the black & white colour theme links of all the interiors, alongside the metal elements that infuse the space with an industrial feel. Envisioned by a local studio Spacedge Designs, the hotel is a great traveller’s spot where heritage and the contemporary character of Singapore meet.

Comment