High demand absorbs inventory at record pace in February

Comment

High demand absorbs inventory at record pace in February

GTA REALTORS® RELEASE FEBRUARY STATS

TORONTO, ONTARIO, March 3, 2021 – Record home sales in the Greater Toronto Area (GTA) continued in February as buyers remained confident in their employment situations and took advantage of ultra-low borrowing costs. With multiple buyers continuing to compete for many available listings, double-digit annual price growth was the norm throughout the GTA, with stronger rates of growth in the suburbs surrounding the City of Toronto.

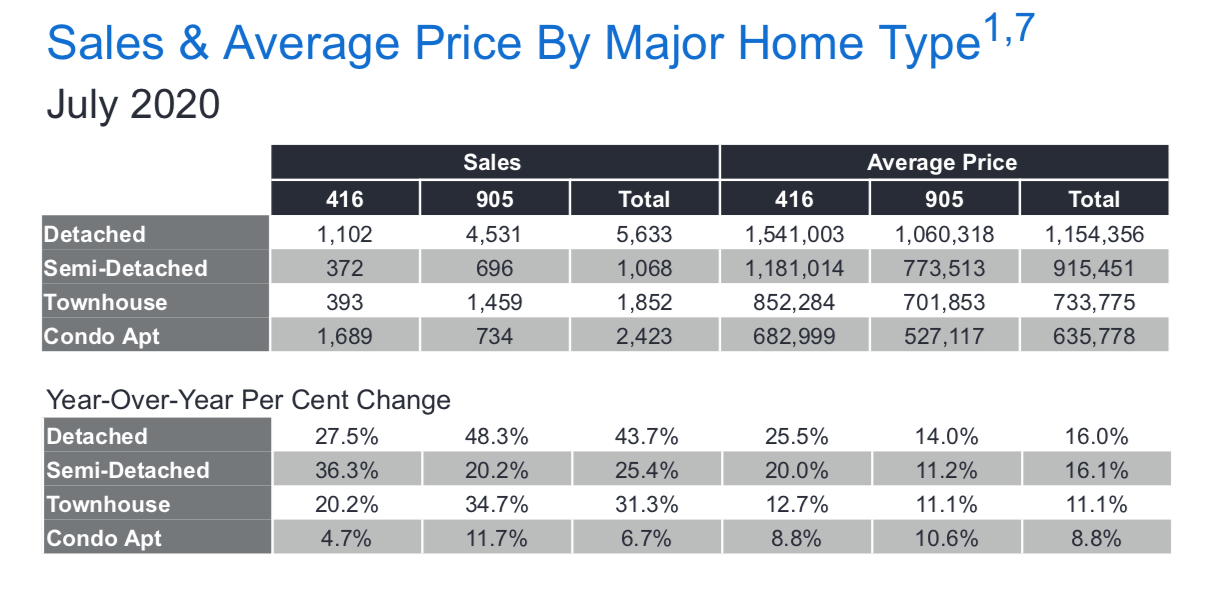
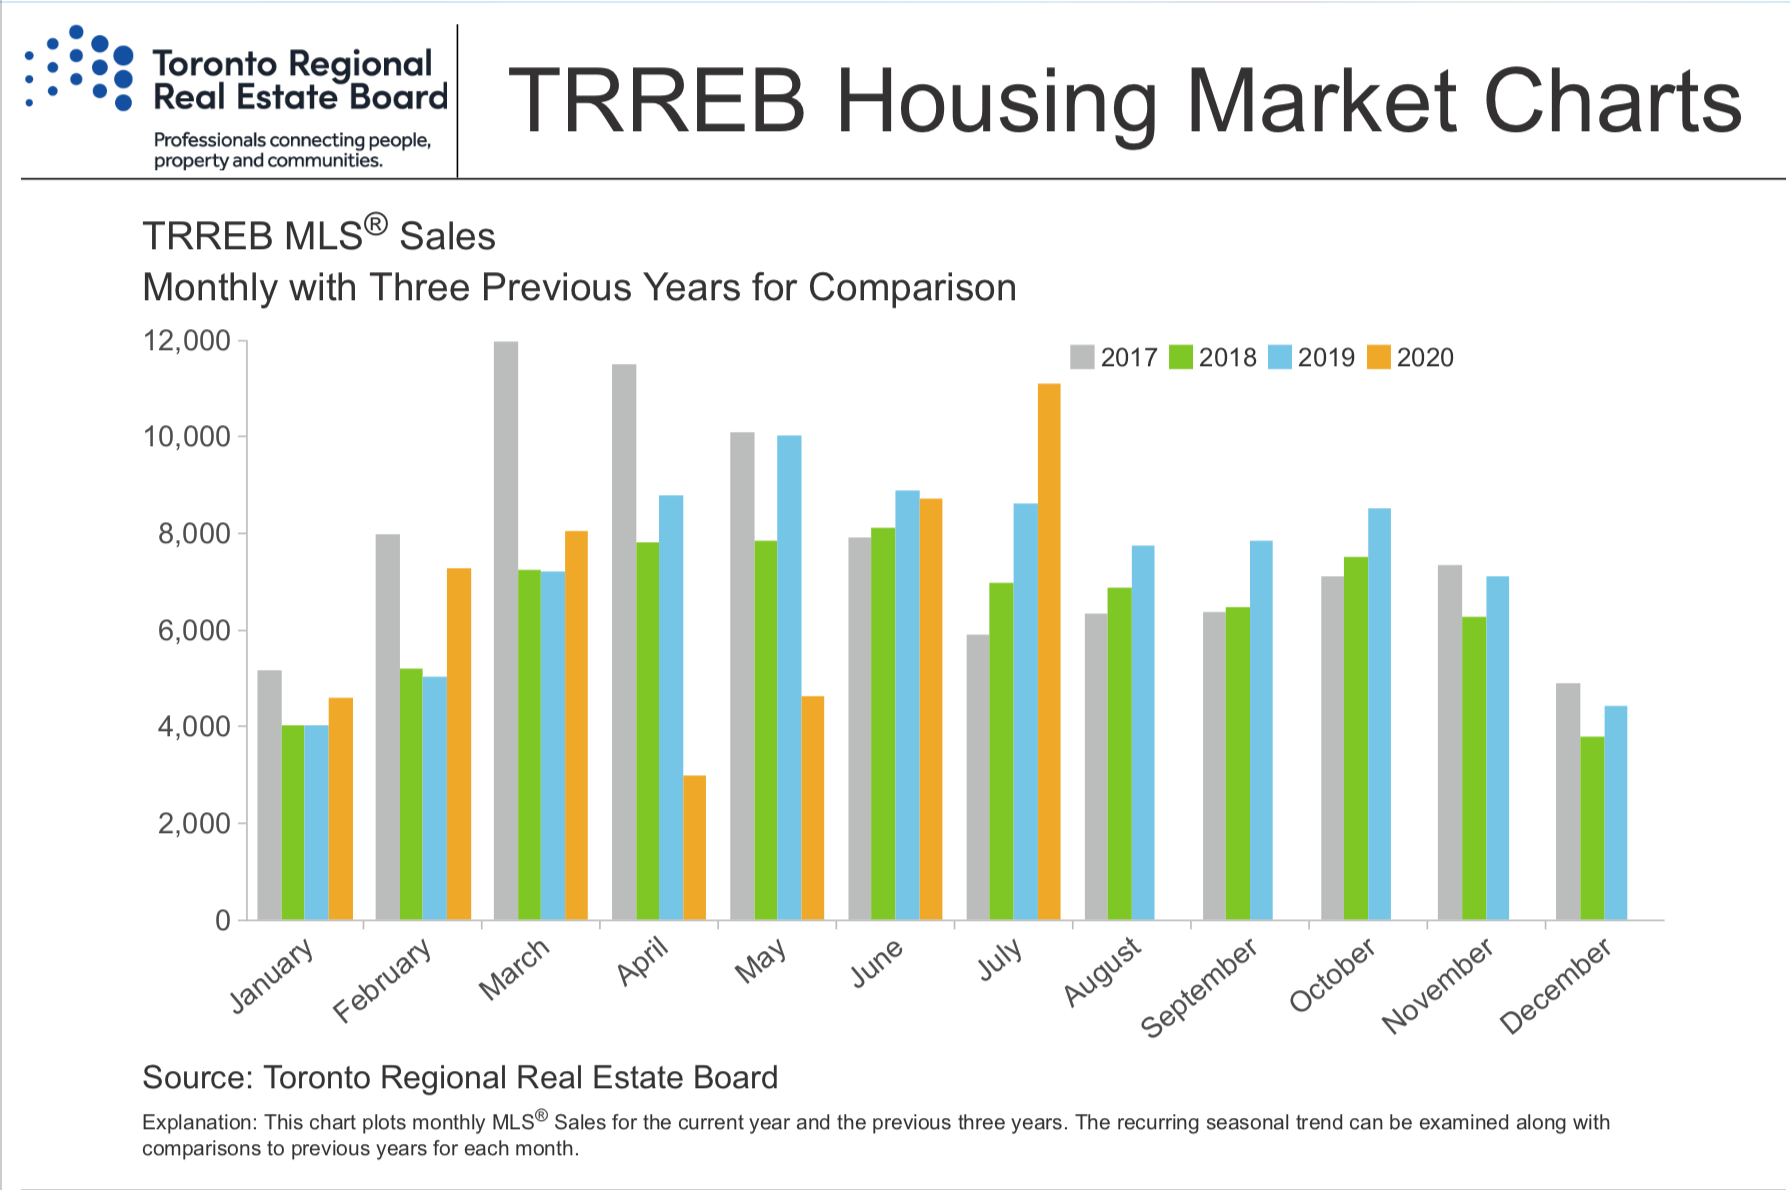
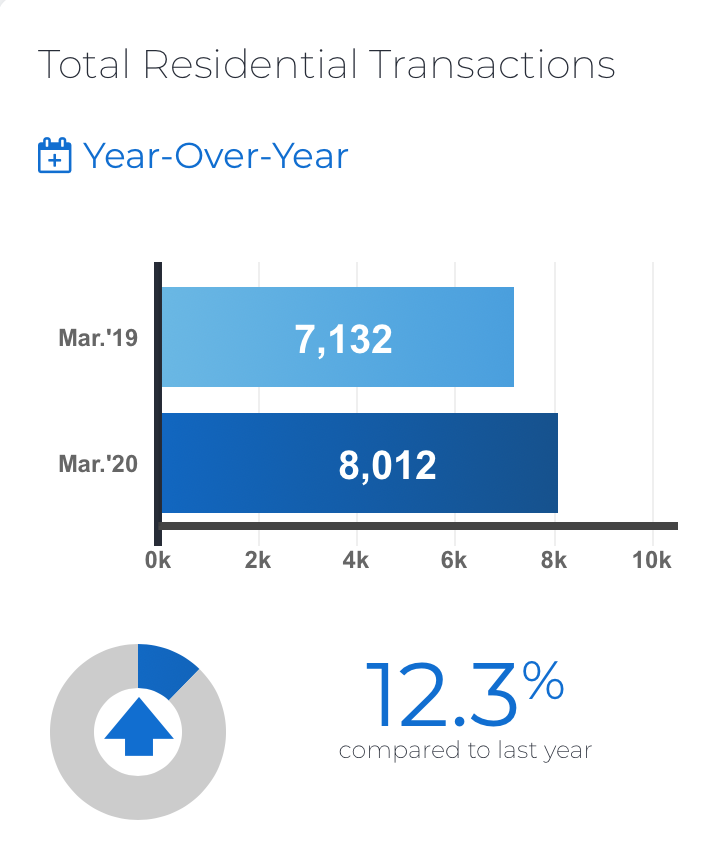
GTA REALTORS® reported 10,970 sales through TRREB’s MLS® System in February 2021 – a 52.5 per cent increase compared to 7,193 sales reported in February 2020. Looking at all areas of the GTA combined, the condominium apartment segment led the way with a 64 per cent sales increase compared to last year, with similar rates of increase in the ‘416’ and ‘905’ area codes.

“It’s clear that the historic demand for housing experienced in the second half of last year has carried forward into the first quarter of this year with some similar themes, including the continued popularity of suburban low-rise properties. It’s also evident that the supply of listings is not keeping up with demand, which could present an even larger problem once population growth picks up following widespread vaccinations later this year and into 2022,” said TRREB President Lisa Patel.

The MLS® Home Price Index Composite Benchmark was up by 14.8 per cent year-over-year in February 2021. Over the same period, the average selling price was up by 14.9 per cent to $1,045,488. While market conditions were tight throughout the GTA region in February, the detached, semi-detached and townhouse market segments in suburban areas were the drivers of average price growth, with annual rates of increase above 20 per cent in all three cases.

“In the absence of a marked uptick in inventory, the current relationship between demand and supply supports continued double-digit average home price growth this year. In addition, if we continue to see growth in condo sales outstrip growth in new condo listings in Toronto, renewed price growth in this market segment is a distinct possibility in the second half of the year,” said TRREB Chief Market Analyst Jason Mercer.

lubabeley.com.png


TRREB Releases Q4 2020 Condo Market Statistics

TORONTO, ONTARIO, January 27, 2021 – Fourth quarter 2020 condominium apartment sales reported by Greater Toronto Area REALTORS® totalled 6,469 – up 20.7 per cent compared to 5,358 in Q4 2019. The number of new listings in Q4 2020 amounted to 12,298 – a 91.9 per cent increase over Q4 2019. Active listings totalling 4,294 at the end of Q4 were more than double that reported at the end of Q4 2019.

“While the prominent storyline has been the strong increase in condo listings over the last 12 months, it is important to point out that the demand for condominium apartments has remained very strong, with sales up substantially compared to 2019. The increase in supply, largely attributed to investor selling as both the traditional and short-term rental markets softened along with the looming possibility of a City of Toronto vacancy tax, resulted in much more choice and bargaining power for buyers and a moderate decline in average selling prices,” said Lisa Patel, Toronto Regional Real Estate Board (TRREB) President.

The overall GTA average condominium apartment selling price was down by 1.1 per cent year over year in the fourth quarter to $610,044. The average selling price in Toronto, at $644,516, was down by 2.4 per cent over the same period. Year-over-year price declines were especially evident for smaller units in the City, where investor-driven supply increases were strong.

“TRREB will be releasing its Market Year in Review and 2021 Outlook report at the beginning of February. With this said, we expect the demand for condo apartments to remain strong this year. Once global vaccine uptake is substantial, the exact timing for which remains uncertain, expect a resurgence in immigration and non-permanent migration into the GTA. This will provide continued support for both ownership and rental demand beyond 2021,” said Jason Mercer, TRREB’s Chief Market Analyst.


TRREB Releases Q4 2020 Rental Market Statistics

TORONTO, ONTARIO, January 27, 2021 – Greater Toronto Area REALTORS® reported 12,584 condominium apartment rentals through TRREB’s MLS® System during the fourth quarter of 2020. This represented an increase of 86.3 per cent compared to 6,756 rentals in Q4 2019. The number of condominium apartments listed for rent during Q4 2020 was up by 131.6 per cent compared to Q4 2019.

“Demand for condominium apartment rentals reached record highs in the second half of 2020, particularly in the fourth quarter. However, at the same time, growth in the number of available units far outstripped growth in rental transactions, as many investors chose to make their units available due to the impact of COVID-19 on tourism and the short-term rental market, City of Toronto restrictions on short-term rentals and the prospect of a vacancy tax. The result was much more choice and negotiating power for renters and a downward adjustment in average rents,” said Lisa Patel, Toronto Regional Real Estate Board (TRREB) President.

The average one-bedroom condominium apartment rent was down by 16.5 per cent year over year in Q4 2020 to $1,845 compared to $2,209 in Q4 2019. The average two-bedroom condominium apartment rent was down by 14.5 per cent over the same time period to $2,453 compared to $2,868.

“As we move through 2021, rental demand will remain strong as the economic situation continues to improve, especially as the pace of the vaccine rollout increases and immigration and non-permanent migration into the GTA accelerates. Eventually, this will result in much of the current rental unit inventory being absorbed, but market conditions will likely continue to favour renters through much of 2021,” said Jason Mercer, TRREB’s Chief Market Analyst.


If you would like to find out what these statistics mean to you, or if you are curious to know how much your property is worth today or how much you can afford to buy, please reach out. 

If you found this article helpful please hit "Like" and "Share".


Comment

Despite lockdowns, January 2021 GTA sales smash records

Comment

Despite lockdowns, January 2021 GTA sales smash records

  • January 2021 home sales amounted to 6,928 – up by more than 50 per cent compared to January 2020. This strong start to 2021 included sales growth across all major segments including condominium apartments, both in the City of Toronto and surrounding GTA regions.

  • New listings were also up on a year-over-year basis in January, but not by the same annual rate as sales. This means market conditions tightened compared to January 2020, resulting in the continuation of double-digit growth in the MLS® Home Price Index and the average selling price.

  • The average selling price for January 2021 was up by 15.5 per cent to $967,885 year-over-year. The MLS® HPI Composite Benchmark was up by 11.9 per cent over the same period.

  • Price growth was driven by the low-rise market segments, while the average condo apartment price was down in Toronto. However, if we continue to see condo sales growth outstrip condo listings growth, we could start to see renewed growth in condo prices later this year.

Screen Shot 2021-02-09 at 6.34.09 PM.png


If you would like to find out what these statistics mean to you, or if you are curious to know how much your property is worth today or how much you can afford to buy, please reach out. 

If you found this article helpful please hit "Like" and "Share".


Comment

Spectacular sales results in December, 2020 finishes strong!

Comment

Spectacular sales results in December, 2020 finishes strong!

GTA REALTORS® Release December Stats

Despite an unprecedented year due to COVID-19, including necessary public health restrictions and uncertainty surrounding the economy, Greater Toronto Area REALTORS® reported over 95,000 home sales in 2020 – the third-best result on record. The average selling price reached a new record of almost $930,000.

“The Greater Toronto Area housing market followed an unfamiliar path in 2020. Following the steep COVID-induced drop-off in demand during the spring, home sales roared back to record levels throughout the summer and fall. A strong economic rebound in many sectors of the economy, ultra-low borrowing costs and the enhanced use of technology for virtual open houses and showings fuelled and sustained the housing market recovery,” said Lisa Patel, Toronto Regional Real Estate Board (TRREB) President.

Highlights from 2020 include:

  • 95,151 sales were reported through TRREB’s MLS® System – up by 8.4 per cent compared to 2019. This included a record result for the month of December, with 7,180 sales – a year-over-year increase of 64.5 per cent.

  • Year-over-year sales growth was strongest in the GTA regions surrounding Toronto, particularly for single-family home types.

  • The average selling price reached a new record of $929,699 – up by 13.5 per cent compared to 2019. This included an average price of $932,222 in December – a year-over-year increase of 11.2 per cent. The strongest average price growth was experienced for single-family home types in the suburban regions of the GTA.

  • After a pronounced dip in market activity between mid-March and the end of May, market conditions improved dramatically in the second half of the year, with multiple consecutive months of record sales and average selling prices.

“While the housing market as a whole recovered strongly in 2020, there was a dichotomy between the single-family market segments and the condominium apartment segment. The supply of single-family homes remained constrained resulting in strong competition between buyers and double-digit price increases. In contrast, growth in condo listings far-outstripped growth in sales. Increased choice for condo buyers ultimately led to more bargaining power and a year-over-year dip in average condo selling prices during the last few months of the year,” said Jason Mercer, TRREB Chief Market Analyst.

If you would like to find out what these statistics mean to you, or if you are curious to know how much your property is worth today or how much you can afford to buy, please reach out. 

If you found this article helpful please hit "Like" and "Share".

*Image - courtesy of Marco Manna, Instagram @markoxto


Comment

November GTA housing market activity driven by consumers seeking more space

Comment

November GTA housing market activity driven by consumers seeking more space

The record pace of home sales in the fall continued with 8,766 sales reported in November by Greater Toronto Area REALTORS® through the Toronto Regional Real Estate Board’s (TRREB) MLS® System. This result was up by 24.3 per cent compared to November of last year.

Generally speaking, year-over-year growth in sales was stronger for single-family homes in the GTA regions surrounding the City of Toronto, but annual single-family growth rates remained robust in the ‘416’ area code as well. “Home buyers continued to take advantage of very low borrowing costs in November, especially those looking to buy some form of single-family home. Competition between buyers for ground-oriented homes has been extremely strong in many neighbourhoods throughout the GTA, which has continued to support double-digit annual rates of price growth,” said Lisa Patel, TRREB President.

The MLS® HPI Composite Benchmark was up by 10.6 per cent in November 2020 compared to November 2019. The average selling price for all home types combined was up by 13.3 per cent to $955,615.

Market conditions tightened in many single-family market segments in November, resulting in double-digit year-over-year increases in average selling prices for detached houses, semi-detached houses and townhouses.

In contrast to the single-family market segments, buyers continued to benefit from much more choice in the condominium apartment market compared to last year, particularly in the City of Toronto. The number of new condominium apartment listings in November was almost double that reported in November of last year. More options in the condo apartment market translated into a small year-over-year decline in the average condominium apartment selling price in the ‘416’ area code.

“The condominium apartment market is certainly more balanced than in previous years, with some buyers benefitting from lower selling prices compared to last year. However, this may be somewhat of a short-term phenomenon. Once we move into the post-COVID period, we will start to see a resumption of population growth, both from immigration and a return of non-permanent residents. This will lead to an increase in demand for condominium apartments in the ownership and rental markets,” said Jason Mercer, TRREB Chief Market Analyst.


If you would like to find out what these statistics mean to you, or if you are curious to know how much your property is worth today or how much you can afford to buy, please reach out. 

If you found this article helpful please hit "Like" and "Share".


Comment

Record sales, record new listings and pandemic influences seen in October 2020

Comment

Record sales, record new listings and pandemic influences seen in October 2020

OCTOBER REAL ESTATE STATS

Home sales in the Greater Toronto Area (GTA) were up again year-over-year for the fourth month in a row. Our Members made 10,563 sales as reported through the Toronto Regional Real Estate Board’s MLS® System in October 2020. This was up by 25.1 per cent compared to 8,445 transactions in October 2019.

Sales and new listings reached record levels for the month of October. However, year-over-year growth rates for sales and new listings diverged in some market segments. In the detached market segment, the pace of annual sales growth far outstripped growth in new listings. Conversely, the condominium apartment market segment experienced more than double the new listings compared to October 2019, whereas sales were only up by 2.2 per cent over the same period.

“Competition between buyers of single-family homes, and particularly detached houses, remained strong last month and continued to support double-digit annual rates of price growth in many GTA neighbourhoods. In contrast, condo buyers have benefitted from much more choice compared to last year. Pre-COVID polling had already pointed to an increase in investor selling in 2020. The pandemic only added to this trend with a stall in economic growth and a halt to tourism impacting cashflows for many investors,” said Lisa Patel, TRREB’s President.

The MLS® HPI Composite Benchmark was up by 10.8 per cent on a year-over-year basis in October 2020. The average selling price for all home types combined was $968,318 – up by 13.7 per cent compared to $851,877 in October 2019.

“Year-to-date home sales through October were above last year’s level. The economic recovery in some sectors coupled with low borrowing costs has kept home purchases top-of-mind for many GTA residents. With this being said, we have not accounted for all of the pent-up demand that resulted from the spring downturn. Expect record or near-record home sales for the remainder of 2020,” said Jason Mercer, TRREB’s Chief Market Analyst.

Screen Shot 2020-11-09 at 1.52.12 PM.png
Screen Shot 2020-11-09 at 1.52.32 PM.png

Q3 2020 Condo Market Statistics

Toronto Regional Real Estate Board President Lisa Patel announced that third quarter 2020 condominium apartment sales reported by Greater Toronto Area REALTORS® totalled 7,072 – up 10.5 per cent from Q3 2019. The number of new listings in Q3 2020 amounted to 17,613 – an 84.6 per cent increase over Q3 2019. Active listings at the end of Q3 were more than double that reported the same time last year.

“The condominium apartment segment experienced the second best third quarter on record in terms of sales and the best third quarter on record in terms of the average selling price. However, while the pace of year-over-year condo sales and price growth remained strong, it was lower than that reported for low-rise home types. The condo market became much better supplied as many investors moved to sell their units, due in part to softer rental market conditions and a short-term rental market that was impacted by stricter regulations and the COVID-19-related drop in tourism,” said Ms. Patel.

The overall average condominium apartment selling price was up by 8.3 per cent year-overyear in the third quarter to $633,484. The average selling price in the City of Toronto, at $680,963, was up by a similar rate over the same period.

“While condo buyers certainly benefitted from more choice in the third quarter compared to the past few years, there was still enough competition between buyers to support average selling prices substantially above last year’s levels. It is important to note that one quarter does not make a trend, either on the demand or supply sides of the market. How the relationship unfolds between condo sales and listings over the next three to six months will dictate the longer-term direction for selling prices,” said Jason Mercer, TRREB’s Chief Market Analyst.

Q3 2020 Condo Rental Market Stats

Toronto Regional Real Estate Board President Lisa Patel announced that Greater Toronto Area REALTORS® reported 14,036 condominium apartment rentals through TRREB’s MLS®System during the third quarter 2020. This was an increase of 30.2 per cent over Q3 2019.

The number of condominium apartments listed for rent at some point during Q3 2020 was up by 113.9 per cent compared to Q3 2019.

“Demand for condo rentals was very strong in the third quarter, with a record number of quarterly transactions reported. However, during the same period, the number of units listed more than doubled compared to last year. Many investor-owners took their units out of the short-term rental market, due to stricter regulations and the COVID-19-related tourism downturn, and made them available in the traditional rental marketplace. The result was more choice and more negotiating power for renters,” said Ms. Patel.

The average one-bedroom condominium apartment rent was down by 11.1 per cent year-overyear in Q3 2020 to $2,012 compared to $2,262 in Q3 2019. The average two-bedroom condominium apartment rent was down by 9.2 per cent over the same time period to $2,672 compared to $2,941 in Q3 2019.

“The demand for condo rentals remained very strong in Q3 as the economy experienced a substantial rebound. However, this demand was overshadowed by the very rapid rise in rental listings. Even if rental transactions remain at or near record levels, it will take some time for the added supply to be absorbed. Once we move into the post-COVID period, population growth from immigration and non-permanent residents will bolster rental demand and absorption,” said Jason Mercer, TRREB’s Chief Market Analyst.


If you would like to find out what these statistics mean to you, or if you are curious to know how much your property is worth today or how much you can afford to buy, please reach out. 

If you found this article helpful please hit "Like" and "Share".


Comment

Another record breaking month for GTA real estate

Comment

Another record breaking month for GTA real estate

TRREB RELEASES SEPTEMBER STATS

TORONTO, ONTARIO, October 6, 2020 – Toronto Regional Real Estate Board President Lisa Patel announced that sales reported through TRREB’s MLS® System by Greater Toronto Area REALTORS® amounted to 11,083 – a new record for the month of September. This result was up by 42.3 per cent compared to September 2019.

Following a record third quarter, sales through the first nine months of 2020 were up by approximately one per cent compared to the same period in 2019.

“Improving economic conditions and extremely low borrowing costs sustained record-level sales in September, as we continued to account for the substantial amount of pent-up demand that resulted from the spring downturn. Further improvements in the economy, including job growth, would support strong home sales moving forward. However, it will be important to monitor the trajectory of COVID-19 cases, the related government policy response, and the impact on jobs and consumer confidence,” said Ms. Patel.

Year-over-year sales growth in September continued to be driven by ground-oriented market segments, including detached and semi-detached houses and townhouses. Annual growth rates were also higher for sales reported in the GTA regions surrounding the City of Toronto.

The September 2020 MLS® Home Price Index Composite Benchmark was up by 11.6 per cent year-over-year. The average selling price for all home types combined in September was $960,772 – up by 14 per cent year-over-year. Price growth was driven by the low-rise market segments. The relatively better supplied condominium apartment segment experienced a comparatively slower pace of price growth.

“On a GTA-wide basis, market conditions tightened in September relative to last year, with sales increasing at a faster pace than new listings. With competition between buyers increasing noticeably, double-digit year-over-year price growth was commonplace throughout the region in September, resulting in the overall average selling price reaching a new record,” said Jason Mercer, TRREB’s Chief Market Analyst.

Screen Shot 2020-10-08 at 1.32.45 PM.png

If you would like to find out what these statistics mean to you, or if you are curious to know how much your property is worth today or how much you can afford to buy, please reach out. 

If you found this article helpful please hit "Like" and "Share".

Comment

August stats hit new records for the month

Comment

August stats hit new records for the month

Toronto Regional Real Estate Board (TRREB) President Lisa Patel announced that the strong rebound in Greater Toronto Area (GTA) home sales continued with a record result for the month of August. GTA REALTORS® reported 10,775 residential sales through TRREB’s MLS® System in August 2020 – up by 40.3 per cent compared to August 2019.

Sales were up on a year-over-year basis for all major home types, both in the City of Toronto and surrounding GTA regions. It should be noted that the low-rise market segments, including detached and semi-detached houses and townhouses, were the drivers of sales growth. Condominium apartment sales were up on an annual basis for the second straight month but to a lesser degree.

“Increased demand for ownership housing has been based on improving economic conditions, in terms of monthly GDP growth and job creation, and the continuation of very low borrowing costs. In addition, fewer households have chosen to go on vacation as a result of COVID-19 and instead have remained in the GTA and been active in the housing market, satisfying pent-up demand from the spring,” said Ms. Patel.

Both the number of new listings entered into TRREB’s MLS® System during the month and the number of active listings at the end of the August 2020 were up on a year-over-year basis. While new listings were up strongly for all home types, growth in new condominium apartment listings far outstripped growth in the other market segments.

“Generally speaking, market conditions remained very tight in the GTA resale market in August. Competition between buyers was especially strong for low-rise home types, leading to robust annual rates of price growth. However, with growth in condominium apartment listings well-outstripping condo sales growth, condo market conditions were comparatively more balanced, which was reflected in a slower pace of price growth in that segment,” said Jason Mercer, TRREB’s Chief Market Analyst.

The MLS® Home Price Index Composite Benchmark was up by 11.1 per cent in August 2020 compared to August 2019. Over the same period, the overall average selling price was up by 20.1 per cent to $951,404. Annual detached and semi-detached sales growth was stronger in the comparatively more-expensive City of Toronto compared to the surrounding GTA regions, which helps explain why growth in the overall average selling price outstripped growth in the MLS® HPI Composite Benchmark.


If you would like to find out what these statistics mean to you, or if you are curious to know how much your property is worth today or how much you can afford to buy, please reach out. 

If you found this article helpful please hit "Like" and "Share".

*Image of Toronto - courtesy of Marco Manna.

Comment

Space matters – Detached Homes Lead July’s Soaring Sales

Comment

Space matters – Detached Homes Lead July’s Soaring Sales

TRREB Releases July Resale Housing Report

Toronto Regional Real Estate Board President Lisa Patel announces that Greater Toronto Area REALTORS® reported 11,081 sales through TRREB’s MLS® System in July 2020 – a 29.5 per cent increase over July 2019 and a new record for the month of July. On a preliminary seasonally adjusted basis, sales were up by 49.5 per cent compared to June 2020.

Year-over-year sales growth was driven by low-rise home types, particularly in the regions surrounding the City of Toronto. However, condominium apartment sales were also up on an annual basis, including in Toronto.

Total new listings were also up strongly on a year-over-year basis by 24.7 per cent, but this annual growth rate was less than that of sales, which means market conditions tightened on average compared to July 2019. In addition, active listings at the end of July were down by 16.3 per cent.

“Sales activity was extremely strong for the first full month of summer. Normally we would see sales dip in July relative to June as more households take vacation, especially with children out of school. This year, however, was different with pent-up demand from the COVID-19-related lull in April and May being satisfied in the summer, as economic recovery takes firmer hold, including the Stage 3 re-opening. In addition, fewer people are travelling, which has likely translated into more transactions and listings,” said Ms. Patel.

The July 2020 MLS® Home Price Index (HPI) Composite Benchmark was up by 10 per cent compared to July 2019. The overall average selling price was up by 16.9 per cent year-over-year to $943,710. On a preliminary seasonally adjusted basis, the average selling price was up by 5.5 per cent compared to June 2020.

Price growth was strongest for low-rise home types, notably within the City of Toronto. Despite more balanced market conditions in the condominium apartment market segment, year-over-year price growth remained in the high single digits.

Screen Shot 2020-08-07 at 4.45.10 PM.png
Screen Shot 2020-08-07 at 4.45.24 PM.png

Sales activity was extremely strong for the first full month of summer. Normally we would see sales dip in July relative to June as more households take vacation, especially with children out of school. This year, however, was different with pent-up demand from the COVID-19-related lull in April and May being satisfied in the summer, as economic recovery takes firmer hold, including the Stage 3 re-opening. In addition, fewer people are travelling, which has likely translated into more transactions and listings,”

–Lisa Patel, TREB President

Screen Shot 2020-08-07 at 4.46.37 PM.png
Screen Shot 2020-08-07 at 4.49.31 PM.png
Screen Shot 2020-08-07 at 4.46.45 PM.png
Screen Shot 2020-08-07 at 4.49.39 PM.png

A gradually improving labour market and historically low mortgage rates are expected to support a recovery in home sales in the second half of 2020 along with sustained year-over-year price growth. Given that home sales result in substantial spin-off expenditure in the regional economy, the housing market will be an important driver of overall economic recovery this year and into 2021.

– Jason Mercer, Director, Market Analysis, TREB

market stats TREB July 2020

Condominium Sales Stats

Screen Shot 2020-08-07 at 4.59.54 PM.png
Screen Shot 2020-08-07 at 5.00.05 PM.png

The condominium apartment market experienced a dip in sales and new listings in the second quarter of 2020, as many potential buyers moved to the sidelines as a result of public health measures taken to combat COVID-19 and the resulting economic downturn. With the overall housing market trending toward recovery in June, condo apartment sales will likely improve in the third quarter.

– Michael Collins, TREB President

Condominium Rental Stats

Screen Shot 2020-08-07 at 5.04.08 PM.png
Screen Shot 2020-08-07 at 5.05.49 PM.png
Screen Shot 2020-08-07 at 5.04.28 PM.png


luba Beley July 2020 market stats

If you would like to find out what these statistics mean to you, or if you are curious to know how much your property is worth today or how much you can afford to buy, please reach out. 

If you found this article helpful please hit "Like" and "Share".


Comment

Positive momentum toward pre-pandemic activity in June

Comment

Positive momentum toward pre-pandemic activity in June

GTA REALTORS® Release June 2020 Stats

Toronto Regional Real Estate Board President Lisa Patel announced that Greater Toronto Area REALTORS® reported 8,701 sales through TRREB’s MLS® System in June 2020. This result represented a very substantial increase over the May 2020 sales result, both on an actual (+89 per cent) and seasonally adjusted basis (+84 per cent), and was only down by 1.4 per cent compared to June 2019.

Year-over-year growth in sales was reported in some areas and market segments. Especially notable were the detached and townhouse market segments in the GTA regions surrounding the City of Toronto. New listings were up slightly on a year-over-year basis by 2.1 per cent. However, active listings on TRREB’s MLS® System at the end of June 2020 were down by 28.8 per cent compared to June 2019. Growth in new listings will need to outstrip growth in sales for a number of months before active listings approach last year’s levels.

The MLS® Home Price Index Composite Benchmark was up by 8.2 per cent year-over-year in June. The average selling price for all home types combined was $930,869 – up by 11.9 per cent compared to June 2019. The actual and seasonally-adjusted average selling price was also up substantially compared to May 2020, by 7.8 per cent and 9.8 per cent respectively.

Average and benchmark selling prices were up year-over-year for all major home types. The strongest average annual rates of price growth were experienced in the detached and semi-detached market segments in the City of Toronto at 14.3 per cent and 22 per cent respectively. This, coupled with the fact that average selling price growth outstripped growth in the MLS® HPI benchmarks, points to a resurgence in the higher-end market segments.

Screen Shot 2020-07-09 at 5.01.37 PM.png
Screen Shot 2020-07-09 at 5.01.58 PM.png

Following the broader movement to reopen the economy in June, we experienced a very positive result in terms of home sales and selling prices. Before the onset of COVID-19, there was a great deal of pent-up demand in the market. This pent-up demand arguably increased further over the past three months. We are still in the early days of recovery, but barring any setbacks, we should continue to see stronger market conditions in the second half of 2020 as households look to satisfy their ownership housing needs.

–Lisa Patel, TREB President

Screen Shot 2020-07-09 at 5.02.39 PM.png
Screen Shot 2020-07-09 at 5.02.49 PM.png
Screen Shot 2020-07-09 at 5.10.55 PM.png
Screen Shot 2020-07-09 at 5.11.05 PM.png

A gradually improving labour market and historically low mortgage rates are expected to support a recovery in home sales in the second half of 2020 along with sustained year-over-year price growth. Given that home sales result in substantial spin-off expenditure in the regional economy, the housing market will be an important driver of overall economic recovery this year and into 2021.

– Jason Mercer, Director, Market Analysis, TREB


Screen Shot 2020-07-09 at 4.56.36 PM.png

If you would like to find out what these statistics mean to you, or if you are curious to know how much your property is worth today or how much you can afford to buy, please reach out. 

If you found this article helpful please hit "Like" and "Share".

*Image of Toronto - courtesy of Marco Manna.


Comment

Substantial month over month recovery in May

Comment

Substantial month over month recovery in May

GTA REALTORS® RELEASE MAY 2020 STATS

TORONTO, ONTARIO, June 3, 2020 – Toronto Regional Real Estate Board President Michael Collins announced that Greater Toronto Area REALTORS® reported 4,606 sales through TRREB’s MLS® System in May 2020. This result was down by 53.7 per cent compared to May 2019. While the number of sales was down substantially on a year-over-year basis due to the continued impact of COVID-19, the decline was less than the 67.1 per cent year-over-year decline reported for April 2020.

On a month-over-month basis, actual and seasonally adjusted May sales were up substantially compared to April. Actual May 2020 sales increased by 55.2 per cent compared to April 2020. After accounting for the regular seasonal increase that is experienced each year between April and May, seasonally adjusted sales were up by 53.2 per cent month-over-month.

The number of new listings entered into TRREB’s MLS® System in May was down by a similar annual rate to that of sales, dipping by 53.1 per cent to 9,104. On a month-over-month basis, actual new listings were up by 47.5 per cent.

The MLS® Home Price Index Composite Benchmark price was virtually unchanged in May 2020 compared to April 2020. On a year-over-year basis, the composite benchmark was up by 9.4 per cent. The average selling price for all home types combined was up by three per cent compared to May 2019 to $863,599. On a seasonally adjusted basis, the average selling price was up by 4.6 per cent month-over-month compared April 2020.

The difference in year-over-year growth between the MLS® HPI Composite Benchmark and the average selling price was related to the fact that home sales in the City of Toronto, particularly in the detached segment, were down by a greater annual rate than overall sales in the GTA. This resulted in a compositional impact on the overall average selling price.

Screen Shot 2020-06-03 at 11.35.30 AM.png
Screen Shot 2020-06-03 at 11.35.50 AM.png

While the public health and economic concerns surrounding COVID-19 continue to impact the housing market, the May sales result represented a marked improvement over April. TRREB released updated Ipsos consumer intentions polling results in May that indicated that 27 per cent of GTA households were likely to purchase a home over the next year. Providing we continue to see a gradual re-opening of the economy, it is very possible that home sales will continue to improve in the coming months.

–John DiMichele, TREB CEO

Screen Shot 2020-06-03 at 11.38.17 AM.png
Screen Shot 2020-06-03 at 11.39.28 AM.png

With home sales and new listings continuing to trend in unison in May, market conditions remained balanced. This balance was evidenced by year-over-year average price growth slightly above the Bank of Canada’s long-term target for inflation. If current market conditions are sustained during the gradual reopening of the GTA economy, a moderate pace of year-over-year price growth could continue as we move through the spring and summer months.

– Jason Mercer, Director, Market Analysis, TREB

Screen Shot 2020-06-03 at 11.50.07 AM.png

If you would like to find out what these statistics mean to you, or if you are curious to know how much your property is worth today or how much you can afford to buy, please reach out. 

If you found this article helpful please hit "Like" and "Share".

*Image of Toronto - courtesy of Marco Manna.


Comment

April 2020 Market Report

Comment

April 2020 Market Report

GTA REALTORS® RELEASE APRIL 2020 STATS

TORONTO, ONTARIO, May 5, 2020 – Toronto Regional Real Estate Board President Michael Collins released the following key housing market statistics for April 2020:

Home Sales and Listings

  • Greater Toronto Area REALTORS® reported 2,975 residential transactions through TRREB’s MLS® System. This result was down by 67 per cent compared to April 2019. Weekday sales remained within a relatively steady range during the month, averaging 130 per day.

  • New listings amounted to 6,174 in April 2020 – down on a year-over-year basis by a similar rate compared to sales (-64.1 per cent).

Screen Shot 2020-05-05 at 10.54.33 AM.png
Screen Shot 2020-05-05 at 10.55.39 AM.png

Home Prices

  • The average selling price for April 2020 transactions was $821,392 – up by 0.1 per cent compared to the average price of $820,373 reported for April 2019. The semi-detached and townhouse market segments experienced annual average price growth above the rate of inflation. The condominium apartment and detached segments experienced year-over-year price declines on average.

  • The trend for the MLS® Home Price Index Composite Benchmark, which had been on an upward trajectory since the beginning of 2019 flattened in April. On a year-over-year basis, the Benchmark was up by 10 per cent.

  • The MLS® HPI indices represent prices for typical homes with consistent attributes from one period to the next. The fact that the MLS® HPI was up year-over-year by a greater rate than the average selling price suggests that the share of higher end deals completed in April 2020 versus April 2019 was down.

Screen Shot 2020-05-05 at 11.31.25 AM.png

Seasonality refers to a monthly (or quarterly) pattern that occurs in roughly the same manner from one year to the next, e.g., sales are highest in the spring and lowest in the winter each year.


The necessary social distancing and economic impacts associated with COVID-19 clearly impacted home sales and listings throughout April 2020. However, REALTORS® have been able to facilitate some transactions on behalf of buyers and sellers through the use of innovative techniques including virtual open houses. TRREB has also provided a live stream virtual open house option on Member listings featured on our public websites, and I would expect the use of these innovative techniques to increase as some level of social distancing remains in place for the foreseeable future. – Jason Mercer, Director, Market Analysis, TREB

If you would like to find out what these statistics mean to you, or if you are curious to know how much your property is worth today or how much you can afford to buy, please reach out. 

If you found this article helpful please hit "Like" and "Share".

*Image of Toronto - courtesy of Marco Manna.


Comment

IMPACT OF COVID-19 ON REAL ESTATE

Comment

IMPACT OF COVID-19 ON REAL ESTATE

TORONTO, ONTARIO, April 22, 2020 – Toronto Regional Real Estate Board President Michael Collins is reporting results for the first 17 days of April 2020, in order to provide some guidance on the impact of COVID-19 on the Greater Toronto Area housing market:

Greater Toronto Area REALTORS® reported 1,654 home sales through TRREB’s MLS® System during the first 17 days of April – down by 69 per cent compared to the same period in 2019.

Year-over-year sales declines in percentage terms, were greatest for the detached and condominium apartment market segments. In the detached segment, the higher end of the market was particularly impacted in the City of Toronto. The condominium apartment segment has traditionally attracted a high share of first-time buyers, who in times of uncertainty can put their decision to purchase on hold.

The number of new listings was down on a year-over-year basis by a similar annual rate, declining by 63.7 per cent to 3,843.

The fact that new listings trended in a similar fashion to sales during the first half of April means that market conditions remained tight enough to provide support for the average selling price in line with 2019 levels.

The average selling price for sales reported during the first 17 days of April 2020 was $819,665 – down by 1.5 per cent compared to the same period in 2019.

Uncertainty about market conditions due to COVID-19 certainly played a role in moderating the pace of year-over-year price growth during the first half of April. The changing composition of home sales also played a role. In the City of Toronto, for example, the number of homes sold for more than two-million dollars declined more than overall sales. This also had an impact on the average selling prices.

It should also be noted that selling prices have also followed listing prices, with average listing prices down by a similar amount. Average selling prices have not been noticeably lower than listing prices compared to last year. This is further evidence that the mix of homes listed has changed compared to last year.

“The state of emergency measures currently in place, including the necessary enforcement of social distancing, has impacted the real estate market in many ways. Home buyers and sellers have concerns about the economy and indeed their own employment situations. On top of this, many buyers and sellers are avoiding any type of in-person interaction. In the condo market in particular, individual condo corporations have curtailed entry for non-residents,” said Mr. Collins.

“All of the COVID-19 related issues and measures have translated into a temporary drop in the number of transactions – a drop that will persist until we experience a meaningful and sustained decline in the number of cases. However, once recovery begins, it will likely accelerate in earnest as buyers seek to satisfy pent- up demand that will build up over the course of the spring and at least part of the summer,” continued Mr. Collins.

“While the necessary social distancing efforts have certainly resulted in a substantial pause to housing transactions, it is possible that REALTORS® and their clients will be able to mitigate the impact somewhat through the use of technology. TRREB and its partner board and association Members can now take advantage of virtual open houses accessed through listing searches on TRREB.ca and REALTOR.ca. TRREB’s professional development staff are also holding virtual webinars on other ways REALTORS can leverage technology to help their clients in these challenging times,” said John DiMichele, TRREB’s CEO.

Looking forward, the decline in home sales will be likely strongest in Q2 2020, as strong social distancing measures remain in place for most of the spring. However, if public health forecasts assuming strong social distancing measures play out as expected, we will likely start to see improvement in market activity in the summer. Recovery will accelerate through the fall, as social distancing measures are substantially relaxed, a large number of people return to work from furlough and home buyers take advantage of very low borrowing costs that will remain in place to spur economic recovery.

The calendar year average price for 2020 will likely remain near the 2019 level, and will be buoyed by the 15 per cent year-over-year growth experienced in Q1 2020 and resumed growth in Q4. Year-over-year declines in home prices could be reported during some months in the second and third quarters, but these declines will have less of an effect on the overall price for 2020 because the annual share of sales will also be much lower than normal.

“As we recover from this temporary downturn, potentially later this year, home buyers will move off the sidelines in increasing numbers as they satisfy pent-up demand for ownership housing. Increasingly, these buyers will be faced with the persistent lack of listings inventory that was a serious problem before the onset of COVID-19. As the different levels of government look toward recovery, it will be important for them to resume and build upon initiatives to bring a greater diversity of housing supply on line,” said Jason Mercer, TRREB’s Chief Market Analyst.

If you would like to find out what these statistics mean to you, or if you are curious to know how much your property is worth today or how much you can afford to buy, please reach out. 

If you found this article helpful please hit "Like" and "Share".

*Image of Toronto - courtesy of Marco Manna.


Comment

AVERAGE SELLING PRICE REMAINS ABOVE LAST YEAR'S LEVELS IN THE SECOND HALF OF MARCH

Comment

AVERAGE SELLING PRICE REMAINS ABOVE LAST YEAR'S LEVELS IN THE SECOND HALF OF MARCH

MARCH MARKET STATISTICS - PRE-COVID-19 AND POST-COVID-19 PERIODS

Toronto Regional Real Estate Board President Michael Collins announced that Greater Toronto Area REALTORS® reported 8,012 home sales through TRREB’s MLS® System in March 2020 – up by 12.3 per cent compared to 7,132 sales reported in March 2019.

However, despite a strong increase in sales for March 2020 as a whole, there was a clear break in market activity between the pre-COVID-19 and post-COVID-19 periods. For the purposes of this release, the start of the post-COVID-19 period was the week beginning Sunday, March 15.

• The overall March sales result was clearly driven by the first two weeks of the month. There were 4,643 sales reported in the pre-COVID-19 period, accounting for 58 per cent of total transactions and representing a 49 per cent increase compared to the first 14 days of March 2019.

• There were 3,369 sales reported during the post-COVID-period – down by 15.9 per cent compared to the same period in March 2019.

Screen Shot 2020-04-07 at 1.30.02 PM.png

For March as a whole, new listings were up by three per cent year-over-year to 14,424. However, similar to sales, new listings dropped on a year-over-year basis during the second half of the month (beginning March 15) by 18.4 per cent.

Despite sales and listings trending lower in the second half of March, demand for ownership housing remained strong enough relative to listings to see the average selling price remain above last year's levels, including during the last few days of the month. As we move through April, we will have a clearer view on how social distancing measures and broader economic conditions will influence sales and ultimately the pace of price growth.

The MLS® Home Price Index Composite Benchmark price was up by 11.1 per cent year-over-year in March 2020. The average selling price for March 2020 as a whole was $902,680 – up 14.5 per cent compared to March 2019.

The average selling price for sales reported between March 15 and March 31, was $862,563 – down from the first half of March 2020, but still up by 10.5 per cent compared to the same period last year.

Screen Shot 2020-04-07 at 1.34.43 PM.png
Screen Shot 2020-04-07 at 1.43.00 PM.png
Screen Shot 2020-04-07 at 1.34.54 PM.png

If you would like to find out what these statistics mean to you, or if you are curious to know how much your property is worth today or how much you can afford to buy, please reach out. 

If you found this article helpful please hit "Like" and "Share".

*Image of Toronto - courtesy of Marco Manna.


Comment

COVID-19 & THE REAL ESTATE INDUSTRY  |  NEW BUSINESS MEASURES

Comment

COVID-19 & THE REAL ESTATE INDUSTRY | NEW BUSINESS MEASURES

rlpnotag_lrg.jpg

COVID-19: HOW TO CONTINUE TO OFFER ESSENTIAL REAL ESTATE SERVICES

March 25, 2020

Dear Colleague,

Across Canada, our governments are taking action to help contain the coronavirus. By mid-March, every province and territory had declared a State of Emergency to deal with the health crisis. Each region is responding with measures that reflect the uniqueness of their situation. It is crucial that we respect directives from local public health authorities and adapt to serve the Canadians who rely on us.

This week, our two most populous provinces, Ontario and Quebec, moved to close all but essential businesses. In Ontario, real estate brokerage was deemed an essential service. In Quebec, where the COVID-19 disease has spread much more widely, the new regulations are more severe. Our Quebec team is restricted to only electronic communication with clients until April 13th.

In all provinces, with the exception of Quebec, I am directing you to conduct business as an essential service.  As an essential service, it is our duty to serve the public, operating with the same public health agency protocols to maximize safety for our clients and ourselves that other essential services are being asked to comply with.

Please understand, no Royal LePage professional should feel pressured to work if they do not wish to, for health or any other reason. If you find yourself in that situation, please let your broker or manager know and they will find someone to help the consumer in need.

During this period, you are obligated to limit your interaction with consumer property and consumers themselves. This directive allows for limited access to homes to facilitate the listing process, including capturing the necessary imaging and details to professionally market the home in a way that minimizes the need for potential buyers to physically visit the property. You should ensure that the home is spotless and that you employ best-practice disinfection techniques.

If you are helping a purchaser, your home-search efforts should focus on electronic showings. We realize that it is unreasonable to expect that a family would make the largest financial commitment of their lives without physically visiting the home they intend to buy. To that end, and to help your buyers confirm that you have found them a suitable home, please begin immediately following the home-showing guidance contained in this communication.

We know how dedicated Royal LePage professionals are to serving their clients' homeownership needs. Today your concern and commitment extends to their health and welfare. Together, we can help contain COVID-19 and work to keep the communities we serve safe while providing the essential shelter-related service we have been called upon to provide.

Finally, we are not asking you to sit in moral judgement when approached to offer your services. In these difficult times, the shoppers and tire-kickers have disappeared. There are thousands of Canadians who find themselves in urgent need of shelter, and thousands more who must find a way to sell their property.  If there ever was a time when the famous Royal LePage motto of 'Helping you is what we do' will resonate with our public, this is that time.  I know that you will rise to the occasion.

Sincerely,

Phil Soper
President & CEO

Royal Lepage Real Estate Services Ltd., Brokerage

A GUIDE FOR ROYAL LEPAGE REALTORS® HERE

If you are thinking of selling or buying due to your individual circumstances, please reach out and I will do my best to advise you of the best practices and assist you with your real estate transaction during these trying times.

YOUR SAFETY IS OUR TOP PRIORITY!


IMPORTANT INFORMATION LINKS:

Toronto Public Health  

https://www.toronto.ca/home/covid-19/    

Ontario Public Heath 

https://www.publichealthontario.ca/en/diseases-and-conditions/infectious-diseases/respiratory-diseases/novel-coronavirus

Health Canada website  

https://www.canada.ca/en/public-health/services/diseases/coronavirus-disease-covid-19.html

Ontario list of Essential Business 

https://www.ontario.ca/page/list-essential-workplaces

Canadian Mortgage and Housing Corporation (CMHC)

https://www.cmhc-schl.gc.ca/en/finance-and-investing/mortgage-loan-insurance/the-resource/covid19-understanding-mortgage-payment-deferral

CIBC

https://www.cibc.com/en/personal-banking/advice-centre/covid-19/financial-assistance.html

Royal Bank

https://www.rbc.com/covid-19/index.html

Bank of Montreal

https://www.bmo.com/covid19

National Bank of Canada

http://www.nbc.ca/personal/notice.html

TD Bank

1-888-720-0075

Scotiabank

1-800-4-SCOTIA

HSBC

1-888-310-4722

Business Bank of Canada- support for entrepreneurs

https://www.bdc.ca/en/pages/special-support.aspx?special-initiative=covid19

Government of Canada- COVID-19 Updates

https://www.canada.ca/en/public-health/services/diseases/2019-novel-coronavirus-infection.html

Province of Ontario- COVID-19 Updates

https://www.ontario.ca/page/2019-novel-coronavirus?_ga=2.50637036.414774865.1579999479-1384618845.1579999479

Public Health Ontario

https://www.publichealthontario.ca/en/diseases-and-conditions/infectious-diseases/respiratory-diseases/novel-coronavirus

COVID-19 Self Assessment

https://covid-19.ontario.ca/self-assessment/#q0

City of Hamilton

https://www.hamilton.ca/coronavirus

Halton Region

https://www.halton.ca/For-Residents/Immunizations-Preventable-Disease/Diseases-Infections/New-Coronavirus

Niagara Region

https://www.niagararegion.ca/health/covid-19/default.aspx

City of Brantford

https://www.brantford.ca/en/living-here/covid-19-response.aspx

Ontario Real Estate Association

https://www.orea.com/COVID-19

EI Benefits Canada

https://www.canada.ca/en/employment-social-development/corporate/notices/coronavirus.html?fbclid=IwAR2s7YUoy11T5XLwRpgMBDdg3vQfPxdhP8sQnbMrM8tnU6nztIgLcmrYipc

​​


RECO bans open houses

MARCH 23, 2020

RECO FINALLY PUTS A BAN ON OPEN HOUSES

Health authorities have provided important guidance to help contain the spread of the COVID-19 virus, directing that people minimize opportunities for transmission of the virus through direct physical interaction.

Conventional open houses, which involve in-person viewing of the property and direct physical interaction with salespeople and other prospective buyers, are the types of activity health authorities are directing be ceased.

We strongly recommend that brokerages and salespeople follow the direction of health officials by declining to facilitate or participate in open houses, and by limiting showings to where they are absolutely necessary.

We support the many brokerages and salespeople who have adopted strategies that promote social distancing, by focusing on virtual, digital and paperless solutions that reduce direct physical interaction during real estate transactions, significantly reducing the risk of transmission. We greatly appreciate the efforts of real estate associations and boards who have, or will be, temporarily suppressing open houses on their MLS® Systems and on public facing websites. 

These are extraordinary times, and everyone should do their part by following the expert direction of health authorities.

Please continue to closely monitor announcements from health authorities and to visit RECO's COVID-19 Notices page for additional information published by RECO.

Do I have to host an open house for my client?

No. As a registrant and business operator, you decide which services you are prepared to offer. You should make those decisions based on the most current guidance and direction of health authorities, which at present is to reduce or eliminate direct physical interaction that could promote transmission of the virus. Information from health authorities is evolving and changing based on current circumstances and facts. Please stay up to date. 

Do I have to participate in showings?

No. As a registrant and business operator, you decide which services you are prepared to offer. You should make those decisions based on the most current guidance and direction of health authorities, which at present is to reduce or eliminate direct physical interaction that could promote transmission of the virus.

In-person meetings and showings should be limited to where they are absolutely necessary. Help your clients understand the importance of following current direction from health authorities and the risks that come with hosting or attending showings. If your client decides to allow showings of their property or to attend showings of other properties, you can decline to participate. As always, you should discuss with your clients the services you are prepared to offer and ways to minimize the risk of transmission of the virus.

If you do decide to participate in a showing, actively promote social distancing and follow recommendations of health authorities about handwashing and sanitizing to reduce the risk for yourself, buyers and sellers.

What are the alternatives to open houses and in-person showings?

Digital technologies offer possible buyers and sellers many ways to show and view a property, without setting foot in the home. Explore virtual marketing tools and strategies, such as video and virtual tours, in addition to conventional photos of the property. Though a buyer may want to see the home in-person before committing, they might be able to reduce the number of in-person showings required by assessing properties through virtual options first. 

Why isn't RECO banning open houses and showings? 

When it comes to issues of public health, RECO follows the direction of health authorities, namely the Ontario Ministry of Health and Long Term Care, who continue to provide guidance to the public and businesses around minimizing the risk of transmission of the COVID-19 virus and other health related issues. 

RECO strongly recommends that brokerages and salespeople decline to host or participate in open houses. Instead, RECO recommends alternative ways of delivering real estate services that minimize direct personal contact to help reduce the transmission of the virus. 

A number of brokerages and salespeople have already adopted this approach, and associations and boards are urging their members to do the same. Some local boards have taken further steps to suspend the ability to have open houses appear on their MLS® systems. 

If you need to know what these changes mean to you, or if you are thinking of selling or buying due to your individual circumstances, please reach out and I will do my best to advise you of the best practices and assist you with your real estate transaction during these trying times.

If you found this article helpful please hit "Like" and "Share".

*Image of Toronto - courtesy of Marco Manna.


Comment

Very strong year-over-year sales and price growth in February

Comment

Very strong year-over-year sales and price growth in February

February market Stats #lubabeley.png

Serious inventory shortage likely to be the single biggest driver for the Spring Market

TORONTO, MARCH 4, 2020 – In line with the forecast contained in the Toronto Regional Real Estate Board’s recently released Market Year in Review and Outlook Report, TRREB President Michael Collins announced a very strong year-over-year sales and price growth in February 2020.

Greater Toronto Area REALTORS® reported 7,256 residential transactions through TRREB’s MLS® System in February 2020, representing a 45.6 per cent increase compared to a 10-year sales low in February 2019. However, February 2020 sales were still below the 2017 record result. Year-over-year sales growth, for the GTA as a whole, was strongest for ground-oriented home types.

After preliminary seasonal adjustment, February 2020 sales also exhibited positive momentum, up by 14.8 per cent compared to January 2020.

New listings amounted to 10,613 in February 2020, a 7.9 per cent increase compared to February 2019. This moderate annual growth rate was much smaller than that reported for sales, which means market conditions tightened considerably over the past year.

As market conditions tightened over the past year, competition between buyers has clearly increased. This resulted in a further acceleration in year-over-year price growth in February. The MLS® Home Price Index Composite Benchmark was up by 10.2 per cent. The average selling price for all home types combined was up by 16.7 per cent to $910,290. Double-digit average price growth was experienced for most major market segments, including detached houses and condominium apartments.

As shown in this 10 year summary of TRREB activity, February 2020 sales have recovered to 95% of February 2016 levels. However, February 2016 saw activation of 6% more new listings than this February, in a year that ultimately saw 85,731 total transactions. Of even greater significance, February 2016 saw 24% more active listings versus this February overall, yet TRREB's forecast for 2020 is for 97,000 transactions or 13% more than occurred in 2016. All this points to increasing pressure to win insufficient product in an environment where buyers are returning post OSFI stress test adjustments, and a return to record low interest rates on the heels of last week's Bank of Canada announcement.

Screen Shot 2020-03-09 at 6.40.41 PM.png

If you would like to find out what these statistics mean to you, or if you are curious to know how much your property is worth today or how much you can afford to buy, please reach out. 

If you found this article helpful please hit "Like" and "Share".

*Image of Toronto - courtesy of Marco Manna.


Comment

Persistent supply crunch spurs price jump

Comment

Persistent supply crunch spurs price jump

Jan 2020 market stats:Luba Beley.png

TRREB President Michael Collins announced that Greater Toronto Area REALTORS® reported 4,581 home sales through TRREB’s MLS® System in January 2020 – up by 15.4 per cent compared to January 2019. On a preliminary seasonally adjusted basis, sales were up by 4.8 per cent compared to December 2019.

“We started 2020 where 2019 left off, with very strong growth in the number of sales up against a continued dip in the number of new and available listings. Tighter market conditions compared to a year ago resulted in much stronger growth in average selling prices. Steady population growth, low unemployment and low borrowing costs continued to underpin substantial competition between buyers in all major market segments,” said Mr. Collins.

The MLS® HPI Composite Benchmark price was up by 8.7 per cent compared to January 2019 – the highest annual rate of growth for the Benchmark since October 2017. The condominium apartment market segment continued to lead the way in terms of MLS HPI® price growth, but all home types experienced price growth above seven per cent when considering the TRREB market area as a whole. The average selling price in January was up by 12.3 per cent, driven by the detached and condominium apartment segments in the City of Toronto.

“A key difference in the price growth story in January 2020 compared to January 2019 was in the low-rise market segments, particularly with regard to detached houses. A year seems to have made a big difference. It is clear that many buyers who were on the sidelines due to the OSFI stress test are moving back into the market, driving very strong year-over-year sales growth in the detached segment. Strong sales up against a constrained supply continues to result in an accelerating rate of price growth,” said Jason Mercer, TRREB’s Director of Market Analysis and Service Channels.

If you would like to find out what these statistics mean to you, or if you are curious to know how much your property is worth today or how much you can afford to buy, please reach out. 

If you found this article helpful please hit "Like" and "Share".

*Image of Toronto - courtesy of Marco Manna.


Comment

December and Annual 2019 Stats - Limited inventory heavily favours Sellers

Comment

December and Annual 2019 Stats - Limited inventory heavily favours Sellers


Dec Market Stats:LubaBeley.png

January 7, 2020  - Toronto Real Estate Board President Michael Collins reported that December 2019 residential sales reported through TREB's MLS® System by Greater Toronto Area REALTORS® were up by 17.4 per cent year-over-year to 4,399. Total sales for calendar year 2019 amounted to 87,825 – up by 12.6 per cent compared to the decade low 78,015 sales reported in 2018. On an annual basis, 2019 sales were in line with the median annual sales result for the past decade.

"We certainly saw a recovery in sales activity in 2019, particularly in the second half of the year. As anticipated, many home buyers who were initially on the sidelines moved back into the market place starting in the spring. Buyer confidence was buoyed by a strong regional economy and declining contract mortgage rates over the course of the year," said Mr. Collins.

While sales were up in 2019, the number of new listings entered into TREB's MLS® System was down by 2.4 per cent year-over-year. For the past decade, annual new listings have been largely in a holding pattern between 150,000 and 160,000, despite the upward trend in home prices over the same period.

"Over the last ten years, TREB has been drawing attention to the housing supply issue in the GTA. Increasingly, policy makers, research groups of varying scope and other interested parties have acknowledged that the lack of a diverse supply of ownership and rental housing continues to hamper housing affordability in the GTA. Taking 2019 as an example, we experienced a strong sales increase up against a decline in supply. Tighter market conditions translated into accelerating price growth. Expect further acceleration in 2020 if there is no relief on the supply front," said Jason Mercer, TREB's Chief Market Analyst.

The MLS® Home Price Index Composite Benchmark was up by 7.3 per cent on a year-over-year basis in December 2019. From June 2019 onward, the annual growth rate in the MLS® HPI Composite Benchmark accelerated. The average selling price in December 2019 was $837,788 – up almost 12 per cent year-over-year. For calendar year 2019, the average selling price was $819,319 – up by four per cent compared to $787,856 in 2018.

If you would like to find out what these statistics mean to you, or if you are curious to know how much your property is worth today or how much you can afford to buy, please reach out. 

If you found this article helpful please hit "Like" and "Share".


Comment

Historic highs and lows for prices and inventory

Comment

Historic highs and lows for prices and inventory

Luba Beley Nov Market Stats.png

GTA REALTORS® Release November 2019 Stats

December 4, 2019  - Toronto Real Estate Board President Michael Collins announced that Greater Toronto Area REALTORS® reported 7,090 sales through TREB's MLS® System in November 2019 – a 14.2 per cent increase compared to November 2018. On a GTA-wide basis, sales were up year-over-year for all major market segments. Annual sales growth in ground oriented home types, including detached houses, led the way. 

New listings entered into TREB's MLS® System in November and the active listings count at the end of the month went in the opposite direction compared to last year, with new listings down 17.9 per cent year-over-year and active listings down 27.2 per cent. 

"An increasing number of home buyers impacted by demand-side policies over the past three years, including the 2017 Ontario Fair Housing Plan and the OSFI mortgage stress test, have moved back into the market for ownership housing. Based on affordability and stricter mortgage qualification standards, many buyers may have likely adjusted their preferences, changing the type and/or location of home they ultimately chose to purchase," said Mr. Collins. 

As market conditions continued to tighten in November 2019, with increased sales up against an increasingly constrained supply of listings, the annual rate of price growth continued to accelerate. The MLS® Home Price Index Composite Benchmark increased by 6.8 per cent year-over-year. The average selling price increased by 7.1 per cent year-over-year to $843,637. Both the MLS® HPI and the average selling price for the TREB market area as a whole experienced the strongest annual rates of price growth for the year in November. 

"Strong population growth in the GTA coupled with declining negotiated mortgage rates resulted in sales accounting for a greater share of listings in November and throughout the second half of 2019. Increased competition between buyers has resulted in an acceleration in price growth. Expect the rate of price growth to increase further if we see no relief on the listings supply front," said Jason Mercer, TREB's Chief Market Analyst.


If you would like to find out what these statistics mean to you, or if you are curious to know how much your property is worth today or how much you can afford to buy, please reach out. 

If you found this article helpful please hit "Like" and "Share".


Comment

More sales, less inventory, rising price growth trends continue

Comment

More sales, less inventory, rising price growth trends continue

Screen Shot 2019-11-06 at 4.19.07 PM.png

TORONTO, November 5, 2019 – Toronto Real Estate Board President Michael Collins announced that Greater Toronto Area REALTORS® reported 8,491 residential sales through TREB’s MLS® System in October 2019. This result represented a 14 per cent increase compared to 7,448 sales reported in October 2018. GTA-wide, sales were up on a year-over-year basis for all major home types.

“A strong regional economy obviously fuels population growth. All of these new households need a place to live and many have the goal of purchasing a home. The problem is that the supply of available listings is actually dropping, resulting in tighter market conditions and accelerating price growth,” said Mr. Collins.

The trend of annual growth in sales versus annual decline in new listings continued in October 2019, with new listings down by 9.6 per cent compared to October 2018. The resulting tighter market conditions compared to a year ago resulted in positive annual rates of price growth across all major market segments, from a GTA-wide perspective.

The MLS® Home Price Index Composite Benchmark was up by 5.8 per cent on a year-over-year basis in October 2019 – the strongest annual rate of growth since December 2017. The average selling price for all home types combined was up by 5.5 per cent to $852,142, compared to $807,538 in October 2018.

“As market conditions in the GTA have steadily tightened throughout 2019, we have seen an acceleration in the annual rate of price growth. While the current pace of price growth remains moderate, we will likely see stronger price growth moving forward if sales growth continues to outpace listings growth, leading to more competition between home buyers,” said Jason Mercer, TREB’s Chief Market Analyst.

If you would like to find out what these statistics mean to you, or if you are curious to know how much your property is worth today or how much you can afford to buy, please reach out. 

If you found this article helpful please hit "Like" and "Share".


Comment

The annual rate of price growth in September reached the highest point so far in 2019

Comment

The annual rate of price growth in September reached the highest point so far in 2019

Screen Shot 2019-10-17 at 10.04.10 AM.png

Toronto Real Estate Board President Michael Collins announced that Greater Toronto Area REALTORS® reported 7,825 sales through TREB’s MLS® System in September 2019. This result represented strong year-over-year sales growth of 22 per cent compared to 6,414 sales reported in September 2018. It is important to note, however, that sales remain well-below the record September 2016 peak of more than 9,800 sales.

On a preliminary seasonally adjusted basis, the September 2019 sales level remained virtually the same as the August 2019 result.

The supply of listings continued to be a concern in September 2019, with new listings down by 1.9 per cent year-over-year to 15,611. We have experienced multiple months this year wherein the annual rate of sales growth outpaced the annual rate of new listings growth, resulting in the overall number of active listings at month-end being well-below last year’s levels. This speaks to tightening market conditions and an accelerating annual rate of price growth.

“Demand for ownership housing increased throughout the spring and summer of 2019 compared to the very slow pace of sales experienced in 2018. That being said, many first-time buyers are still experiencing difficulty finding an affordable home. Federal parties vying for seats in the October election have pledged to alleviate affordability issues hampering first-time buyers with a variety of policy proposals. While these demand-side proposals are important, it is also important that all levels of government remain focused on promoting a sustainable supply of different housing types moving forward,” said Mr. Collins.

The annual rate of price growth in September reached the highest point so far in 2019. The MLS® Home Price Index (HPI) Composite Benchmark was up by 5.2 per cent on a year-over-year basis in September. The average selling price for all home types combined was up by a similar annual rate of 5.8 per cent to $843,115.

On a preliminary seasonally adjusted basis, the September 2019 average selling price was up by 1.2 per cent compared to August 2019.

“It is interesting to note that market conditions for detached homes have tightened over the past year. In many of the regions surrounding the City of Toronto, detached price growth was above the rate of inflation on an annual basis. Consumer polling conducted for TREB over the past few years has pointed out that many intending home buyers are still focused on ground-oriented housing. This points to the need for a greater diversity of housing types to bridge the gap between detached houses and condominium apartments,” said Jason Mercer, TREB’s Chief Market Analyst.

“Statistics Canada’s most recent national population estimate represented the highest twelve month population increase ever recorded. This growth was driven by immigration, of which the GTA was likely a key beneficiary due to its strong regional economy and diversity. As a result, the demand for all types of housing in the GTA – rental and ownership – will remain strong. This fact underpins the need for immediate and sustained action on housing supply,” said TREB CEO John DiMichele.


If you would like to find out what these statistics mean to you, or if you are curious to know how much your property is worth today or how much you can afford to buy, please reach out. 

If you found this article helpful please hit "Like" and "Share".


Comment