Viewing entries in
REAL ESTATE

GTA Housing Market Begins the Year with Higher Sales Activity as Consumer Confidence Returns

Comment

GTA Housing Market Begins the Year with Higher Sales Activity as Consumer Confidence Returns

The GTA housing market is beginning to gain momentum, exhibiting robust sales figures across all asset classes in January as compared to last year. The average home sale price for the month settled at $1,026,703, closely mirroring the figures from the same period in 2023. However, the market's activity suggests that 2024 is gearing up to be a considerably busier year than its predecessor.

Total active listings hit 10,093, a 8.5% yearly increase. Although the increase in inventory was modest, it was swiftly overshadowed by strong sales numbers, signalling a resurgence of buyer confidence. Sales surged across the GTA, reaching 4,223, marking impressive 36% yearly growth.

Experts anticipate further market acceleration in the latter part of the year. This period, prior to any decision by the Bank of Canada to lower interest rates, represents a timely opportunity for potential homebuyers to act before market competition picks up. 

As highlighted in a recent Globe and Mail article, attempting to time the mortgage rate cuts may not be the best path forward. “The truth is no one knows the future of interest rates – even Mr. Macklem is uncertain about the possibility and timing of rate cuts. For first-time home buyers navigating the uncertainty, it’s crucial to acknowledge that a crystal ball for mortgage rates doesn’t exist. And getting caught up in the hype and uncertainty surrounding the future of rates is dangerous. When you buy your first home, aim for a reasonable degree of certainty regarding the people in your life and your housing needs; otherwise, you will end up having to sell sooner than you had planned and perhaps in unfavourable market conditions, costing yourself tens or even hundreds of thousands of dollars.”

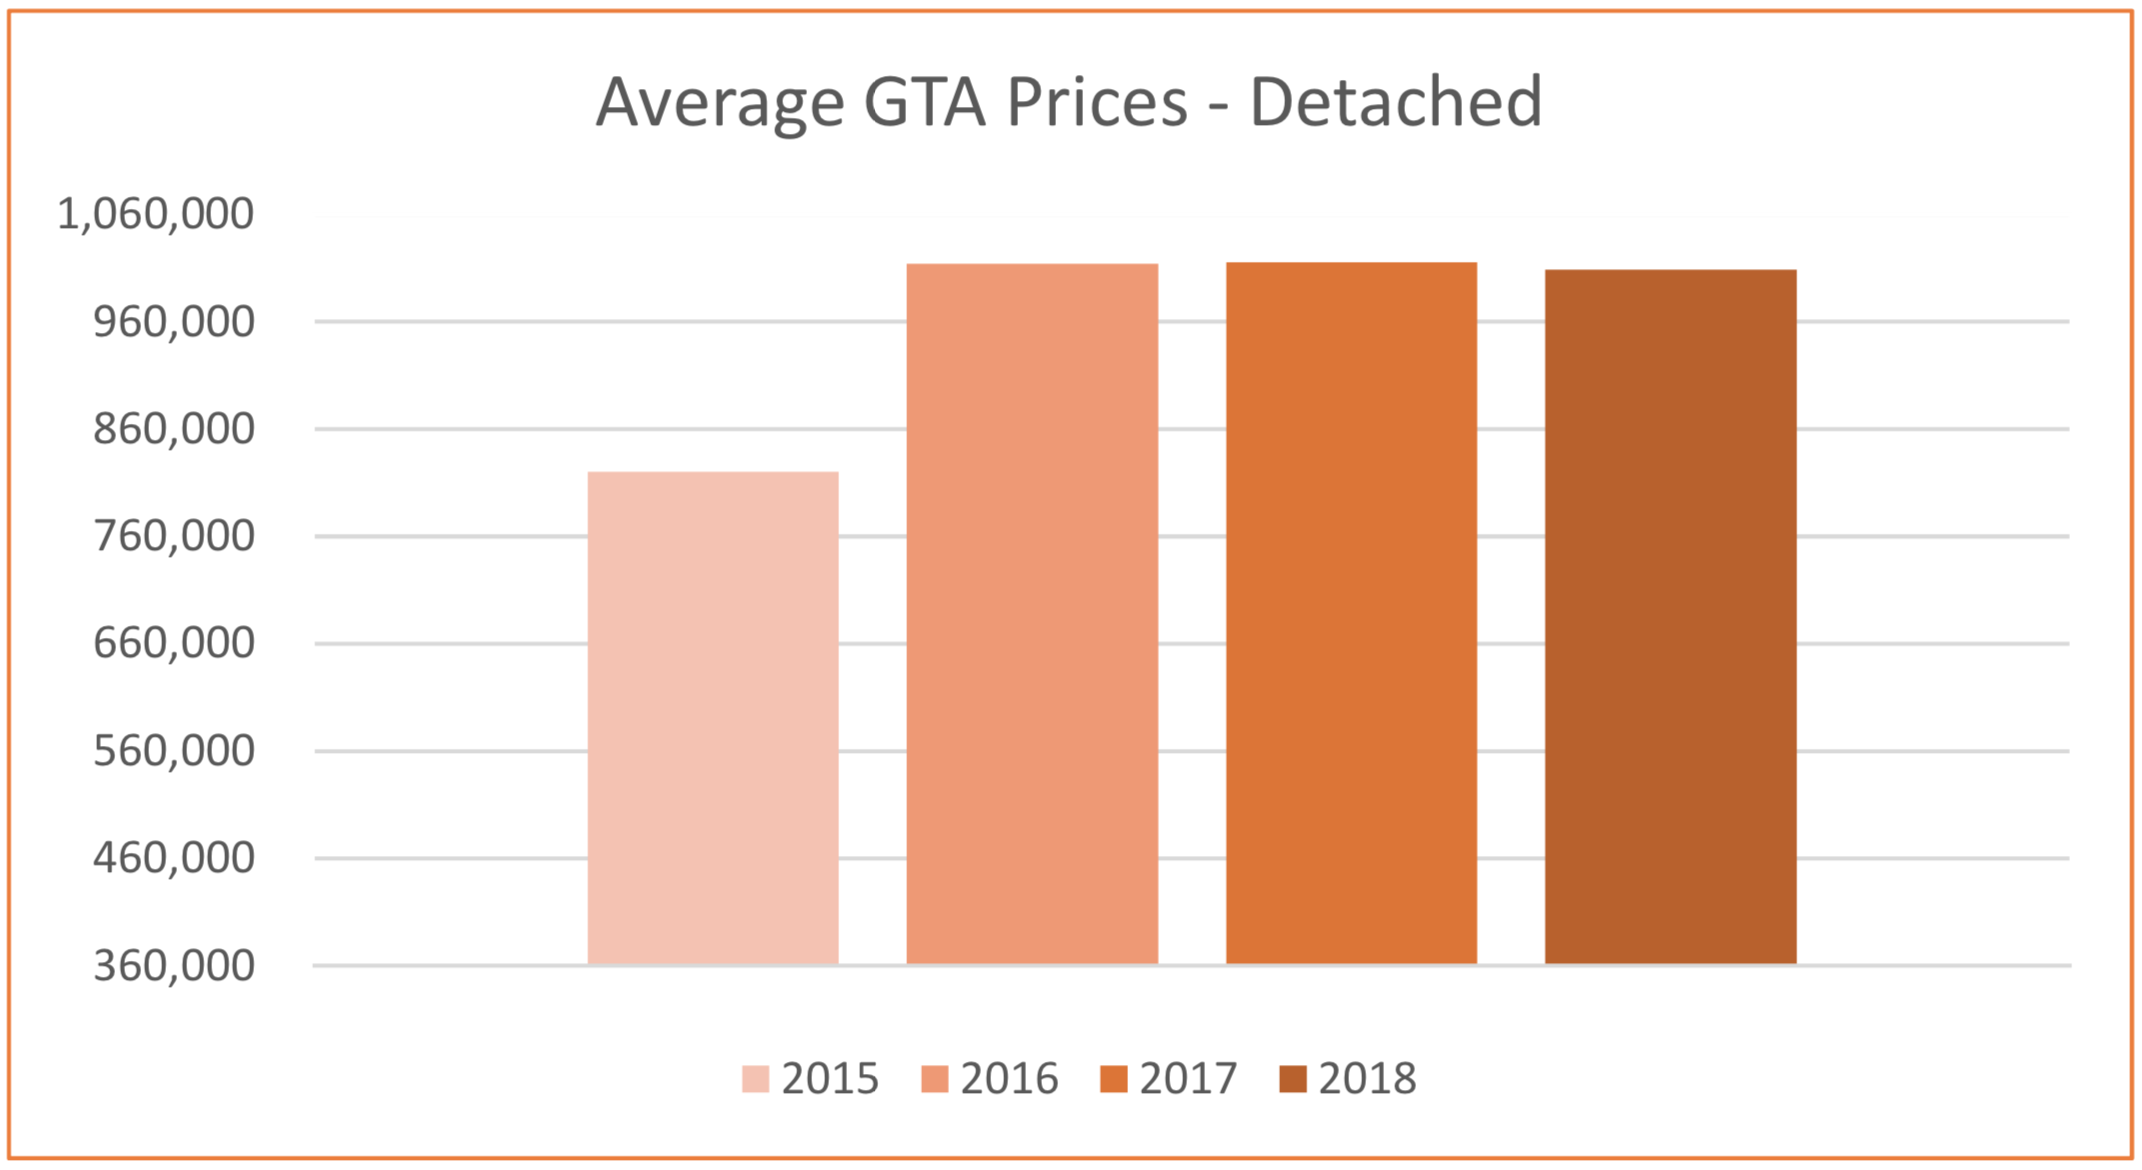
While not all asset classes experienced yearly gains, both the detached and semi-detached markets in the GTA saw price appreciation. In the detached market, average sales prices saw an increase of $8,980, resulting in an average sales price of $1,350,828. Although the price increase was nominal compared to the previous year, there are strong indications that buyers are becoming more active. Sales increased by 26% annually, totalling 1,745 sales during the month. However, inventory for detached properties experienced an 8.7% decline compared to January 2023, with active listings totalling just 3,589.

The semi-detached market, on the other hand saw an average sales price of $1,038,303 in January, indicating an $18,635 yearly increase. This price increase was supported by a 42.9% yearly increase in total sales. Similar to the detached market, the semi-detached inventory started the year with a 21% decrease compared to January 2023. The ongoing inventory shortage that characterized the GTA throughout 2023 continued into the first month of 2024. Nevertheless, the strong sales environment is expected to drive price gains as competition among buyers intensifies once again.

The GTA condo market experienced a 40.5% increase in total sales, while the yearly sales price saw a modest decline of less than 1%.  The strong increase in sales activity suggests that price increases are likely in the near future. Similarly, the townhouse segment of the market saw a 59.5% yearly sales increase, totalling 442 transactions. With only 539 active listings to end the month, the limited availability of properties is likely to drive prices higher.

“We had a positive start to 2024. The Bank of Canada expects the rate of inflation to recede as we move through the year. This would support lower interest rates which would bolster home buyers' confidence to move back into the market. First-time buyers currently facing high average rents would benefit from lower mortgage rates, making the move to homeownership more affordable,” said TRREB President Jennifer Pearce.

The renewed market strength projected for the latter half of the year seems to be gaining traction earlier than expected. In light of this, both buyers and sellers should be prepared to make informed decisions as the market continues to unfold.

If you would like to understand how these statistics relate to your specific situation or if you're curious about the current value of your property or your affordability for a new purchase, please don't hesitate to reach out.

If you found this article informative and useful, we kindly ask you to show your support by hitting the "Like" and "Share" buttons. Your engagement is greatly appreciated.

JanuaryMarketReport #realestatemarketreport #royallepage #torontoliving #torontomarket #thejunction #highpark #bloorwestvillage #swansea #homesellers #homebuyers #realestatebroker #lubabeleybroker #sellingrealestate #sellingtorontohomes #serviceyoucantrust #workingforyou #lubabeleyrealestateservices #royallepagebroker

Comment

GTA Real Estate 2023: A Resilient Journey and the Return of Optimism

Comment

GTA Real Estate 2023: A Resilient Journey and the Return of Optimism

GTA Real Estate 2023: A Resilient Journey and the Return of Optimism

The GTA housing market experienced some turbulence throughout 2023; however, its enduring resilience remains the standout feature. Commencing the year with an average sales price of $1,038,668, properties saw a remarkable 15% surge by May, reaching an average sale price of $1,196,101. The latter half of the year witnessed a surge in inventory, peaking at 19,540 properties in October. The increase in inventory, paired with two additional interest rate increases in early summer dampened the increase in property values, however homes in the GTA were, on average, worth more in December 2023 than they were at the beginning of 2023, with an average sales price of $1,084,692. However, sales faced challenges, with 66,252 total properties sold in 2023, representing a 28% decrease compared to the previous five-year average.  Sales will not remain as subdued in 2024.  As we move through the year, we anticipate higher sales volume and more competition returning to the market.  

“Buyers who were active in the market benefitted from more choice throughout 2023. This allowed many of these buyers to negotiate lower selling prices, alleviating some of the impact of higher borrowing costs. Assuming borrowing costs trend lower this year, look for tighter market conditions to prompt renewed price growth in the months ahead,” said TRREB Chief Market Analyst Jason Mercer.

Mortgage rates were a focal point in 2023, and anticipation for 2024 revolves around potential interest rate decreases. Once rates do begin to wane values are likely to escalate as Royal LePage CEO Phil Soper recently highlighted. “We see 2024 as an important tipping point for the national economy as the majority of Canadians acknowledge that the ultra-low interest rate era is dead and gone,” “We believe that the ‘great adjustment’ to tolerable, mid-single-digit borrowing costs will have a firm grip on our collective consciousness after only modest rate cuts by the Bank of Canada.”  What does this mean for property values throughout 2024? Phil Soper spoke to that as well. “Based on this forecast, by the end of next year, home prices will have essentially climbed back to their pandemic peak, reached in the first quarter of 2022,” he said. 

As 2024 exhibits renewed optimism, let's recap the performance of individual asset classes in 2023. The Detached segment led the way, starting with an average sales price of $1,314,848 and achieving a robust 16% increase in May, concluding the year with an average sales price of $1,418,323—a  5.69% gain.

The townhouse market secured the second spot, commencing the year at an average sale price of $976,500. A 14.45% surge in May led values to a yearly high of $1,117,696. As the year progressed values compressed and resulted in a year-end sale price of $996,162, reflecting a 2% gain.

The semi-detached asset class claimed the third position, starting the year at an average sales price of $1,019,668. With a high-water price of $1,214,872 in June, values finished the year at $1,027,432, representing just under a 1% gain over the year.

Conversely, the condo asset class is the only segment to slightly drop in value during the year. January began with values of $687,696. Despite an 8.8% increase to $748,483 during May, the year concluded with an average of $682,525, marking a loss of 0.75% in 2023 and marking an excellent opportunity, particularly for first-time buyers, to enter the market while price points are stable and inventory is available. 

The resilience of the market was evident throughout 2023 and the forecast for 2024 is a clear indicator that demand for housing is not waning. A recent article in the Toronto Star  succinctly summarizes the current state of the market.  "Real estate is cyclical and we've hit the lowest point in the fourth quarter of 2023 in terms of sales activity and prices,”."There's going to be a tipping point next year during the spring from all this pent up demand and strong indication from the Bank of Canada that it will begin to cut rates."

In conclusion, the GTA housing market weathered the uncertainty of 2023 with unwavering resilience. Moving into 2024, there are positive indicators for recovery and growth, and greater confidence in the potential for a robust comeback. The cyclical nature of real estate, coupled with anticipated rate cuts and pent-up demand, positions the market for a spring resurgence. 

If you would like to understand how these statistics relate to your specific situation or if you're curious about the current value of your property or your affordability for a new purchase, please don't hesitate to reach out.

If you found this article informative and useful, we kindly ask you to show your support by hitting the "Like" and "Share" buttons. Your engagement is greatly appreciated.

DecemberMarketReport #realestatemarketreport #royallepage #torontoliving #torontomarket #thejunction #highpark #bloorwestvillage #swansea #homesellers #homebuyers #realestatebroker #lubabeleybroker #sellingrealestate #sellingtorontohomes #serviceyoucantrust #workingforyou #lubabeleyrealestateservices #royallepagebroker


Comment

Very strong year-over-year sales and price growth in February

Comment

Very strong year-over-year sales and price growth in February

February market Stats #lubabeley.png

Serious inventory shortage likely to be the single biggest driver for the Spring Market

TORONTO, MARCH 4, 2020 – In line with the forecast contained in the Toronto Regional Real Estate Board’s recently released Market Year in Review and Outlook Report, TRREB President Michael Collins announced a very strong year-over-year sales and price growth in February 2020.

Greater Toronto Area REALTORS® reported 7,256 residential transactions through TRREB’s MLS® System in February 2020, representing a 45.6 per cent increase compared to a 10-year sales low in February 2019. However, February 2020 sales were still below the 2017 record result. Year-over-year sales growth, for the GTA as a whole, was strongest for ground-oriented home types.

After preliminary seasonal adjustment, February 2020 sales also exhibited positive momentum, up by 14.8 per cent compared to January 2020.

New listings amounted to 10,613 in February 2020, a 7.9 per cent increase compared to February 2019. This moderate annual growth rate was much smaller than that reported for sales, which means market conditions tightened considerably over the past year.

As market conditions tightened over the past year, competition between buyers has clearly increased. This resulted in a further acceleration in year-over-year price growth in February. The MLS® Home Price Index Composite Benchmark was up by 10.2 per cent. The average selling price for all home types combined was up by 16.7 per cent to $910,290. Double-digit average price growth was experienced for most major market segments, including detached houses and condominium apartments.

As shown in this 10 year summary of TRREB activity, February 2020 sales have recovered to 95% of February 2016 levels. However, February 2016 saw activation of 6% more new listings than this February, in a year that ultimately saw 85,731 total transactions. Of even greater significance, February 2016 saw 24% more active listings versus this February overall, yet TRREB's forecast for 2020 is for 97,000 transactions or 13% more than occurred in 2016. All this points to increasing pressure to win insufficient product in an environment where buyers are returning post OSFI stress test adjustments, and a return to record low interest rates on the heels of last week's Bank of Canada announcement.

Screen Shot 2020-03-09 at 6.40.41 PM.png

If you would like to find out what these statistics mean to you, or if you are curious to know how much your property is worth today or how much you can afford to buy, please reach out. 

If you found this article helpful please hit "Like" and "Share".

*Image of Toronto - courtesy of Marco Manna.


Comment

Persistent supply crunch spurs price jump

Comment

Persistent supply crunch spurs price jump

Jan 2020 market stats:Luba Beley.png

TRREB President Michael Collins announced that Greater Toronto Area REALTORS® reported 4,581 home sales through TRREB’s MLS® System in January 2020 – up by 15.4 per cent compared to January 2019. On a preliminary seasonally adjusted basis, sales were up by 4.8 per cent compared to December 2019.

“We started 2020 where 2019 left off, with very strong growth in the number of sales up against a continued dip in the number of new and available listings. Tighter market conditions compared to a year ago resulted in much stronger growth in average selling prices. Steady population growth, low unemployment and low borrowing costs continued to underpin substantial competition between buyers in all major market segments,” said Mr. Collins.

The MLS® HPI Composite Benchmark price was up by 8.7 per cent compared to January 2019 – the highest annual rate of growth for the Benchmark since October 2017. The condominium apartment market segment continued to lead the way in terms of MLS HPI® price growth, but all home types experienced price growth above seven per cent when considering the TRREB market area as a whole. The average selling price in January was up by 12.3 per cent, driven by the detached and condominium apartment segments in the City of Toronto.

“A key difference in the price growth story in January 2020 compared to January 2019 was in the low-rise market segments, particularly with regard to detached houses. A year seems to have made a big difference. It is clear that many buyers who were on the sidelines due to the OSFI stress test are moving back into the market, driving very strong year-over-year sales growth in the detached segment. Strong sales up against a constrained supply continues to result in an accelerating rate of price growth,” said Jason Mercer, TRREB’s Director of Market Analysis and Service Channels.

If you would like to find out what these statistics mean to you, or if you are curious to know how much your property is worth today or how much you can afford to buy, please reach out. 

If you found this article helpful please hit "Like" and "Share".

*Image of Toronto - courtesy of Marco Manna.


Comment

December and Annual 2019 Stats - Limited inventory heavily favours Sellers

Comment

December and Annual 2019 Stats - Limited inventory heavily favours Sellers


Dec Market Stats:LubaBeley.png

January 7, 2020  - Toronto Real Estate Board President Michael Collins reported that December 2019 residential sales reported through TREB's MLS® System by Greater Toronto Area REALTORS® were up by 17.4 per cent year-over-year to 4,399. Total sales for calendar year 2019 amounted to 87,825 – up by 12.6 per cent compared to the decade low 78,015 sales reported in 2018. On an annual basis, 2019 sales were in line with the median annual sales result for the past decade.

"We certainly saw a recovery in sales activity in 2019, particularly in the second half of the year. As anticipated, many home buyers who were initially on the sidelines moved back into the market place starting in the spring. Buyer confidence was buoyed by a strong regional economy and declining contract mortgage rates over the course of the year," said Mr. Collins.

While sales were up in 2019, the number of new listings entered into TREB's MLS® System was down by 2.4 per cent year-over-year. For the past decade, annual new listings have been largely in a holding pattern between 150,000 and 160,000, despite the upward trend in home prices over the same period.

"Over the last ten years, TREB has been drawing attention to the housing supply issue in the GTA. Increasingly, policy makers, research groups of varying scope and other interested parties have acknowledged that the lack of a diverse supply of ownership and rental housing continues to hamper housing affordability in the GTA. Taking 2019 as an example, we experienced a strong sales increase up against a decline in supply. Tighter market conditions translated into accelerating price growth. Expect further acceleration in 2020 if there is no relief on the supply front," said Jason Mercer, TREB's Chief Market Analyst.

The MLS® Home Price Index Composite Benchmark was up by 7.3 per cent on a year-over-year basis in December 2019. From June 2019 onward, the annual growth rate in the MLS® HPI Composite Benchmark accelerated. The average selling price in December 2019 was $837,788 – up almost 12 per cent year-over-year. For calendar year 2019, the average selling price was $819,319 – up by four per cent compared to $787,856 in 2018.

If you would like to find out what these statistics mean to you, or if you are curious to know how much your property is worth today or how much you can afford to buy, please reach out. 

If you found this article helpful please hit "Like" and "Share".


Comment

Historic highs and lows for prices and inventory

Comment

Historic highs and lows for prices and inventory

Luba Beley Nov Market Stats.png

GTA REALTORS® Release November 2019 Stats

December 4, 2019  - Toronto Real Estate Board President Michael Collins announced that Greater Toronto Area REALTORS® reported 7,090 sales through TREB's MLS® System in November 2019 – a 14.2 per cent increase compared to November 2018. On a GTA-wide basis, sales were up year-over-year for all major market segments. Annual sales growth in ground oriented home types, including detached houses, led the way. 

New listings entered into TREB's MLS® System in November and the active listings count at the end of the month went in the opposite direction compared to last year, with new listings down 17.9 per cent year-over-year and active listings down 27.2 per cent. 

"An increasing number of home buyers impacted by demand-side policies over the past three years, including the 2017 Ontario Fair Housing Plan and the OSFI mortgage stress test, have moved back into the market for ownership housing. Based on affordability and stricter mortgage qualification standards, many buyers may have likely adjusted their preferences, changing the type and/or location of home they ultimately chose to purchase," said Mr. Collins. 

As market conditions continued to tighten in November 2019, with increased sales up against an increasingly constrained supply of listings, the annual rate of price growth continued to accelerate. The MLS® Home Price Index Composite Benchmark increased by 6.8 per cent year-over-year. The average selling price increased by 7.1 per cent year-over-year to $843,637. Both the MLS® HPI and the average selling price for the TREB market area as a whole experienced the strongest annual rates of price growth for the year in November. 

"Strong population growth in the GTA coupled with declining negotiated mortgage rates resulted in sales accounting for a greater share of listings in November and throughout the second half of 2019. Increased competition between buyers has resulted in an acceleration in price growth. Expect the rate of price growth to increase further if we see no relief on the listings supply front," said Jason Mercer, TREB's Chief Market Analyst.


If you would like to find out what these statistics mean to you, or if you are curious to know how much your property is worth today or how much you can afford to buy, please reach out. 

If you found this article helpful please hit "Like" and "Share".


Comment

More sales, less inventory, rising price growth trends continue

Comment

More sales, less inventory, rising price growth trends continue

Screen Shot 2019-11-06 at 4.19.07 PM.png

TORONTO, November 5, 2019 – Toronto Real Estate Board President Michael Collins announced that Greater Toronto Area REALTORS® reported 8,491 residential sales through TREB’s MLS® System in October 2019. This result represented a 14 per cent increase compared to 7,448 sales reported in October 2018. GTA-wide, sales were up on a year-over-year basis for all major home types.

“A strong regional economy obviously fuels population growth. All of these new households need a place to live and many have the goal of purchasing a home. The problem is that the supply of available listings is actually dropping, resulting in tighter market conditions and accelerating price growth,” said Mr. Collins.

The trend of annual growth in sales versus annual decline in new listings continued in October 2019, with new listings down by 9.6 per cent compared to October 2018. The resulting tighter market conditions compared to a year ago resulted in positive annual rates of price growth across all major market segments, from a GTA-wide perspective.

The MLS® Home Price Index Composite Benchmark was up by 5.8 per cent on a year-over-year basis in October 2019 – the strongest annual rate of growth since December 2017. The average selling price for all home types combined was up by 5.5 per cent to $852,142, compared to $807,538 in October 2018.

“As market conditions in the GTA have steadily tightened throughout 2019, we have seen an acceleration in the annual rate of price growth. While the current pace of price growth remains moderate, we will likely see stronger price growth moving forward if sales growth continues to outpace listings growth, leading to more competition between home buyers,” said Jason Mercer, TREB’s Chief Market Analyst.

If you would like to find out what these statistics mean to you, or if you are curious to know how much your property is worth today or how much you can afford to buy, please reach out. 

If you found this article helpful please hit "Like" and "Share".


Comment

The annual rate of price growth in September reached the highest point so far in 2019

Comment

The annual rate of price growth in September reached the highest point so far in 2019

Screen Shot 2019-10-17 at 10.04.10 AM.png

Toronto Real Estate Board President Michael Collins announced that Greater Toronto Area REALTORS® reported 7,825 sales through TREB’s MLS® System in September 2019. This result represented strong year-over-year sales growth of 22 per cent compared to 6,414 sales reported in September 2018. It is important to note, however, that sales remain well-below the record September 2016 peak of more than 9,800 sales.

On a preliminary seasonally adjusted basis, the September 2019 sales level remained virtually the same as the August 2019 result.

The supply of listings continued to be a concern in September 2019, with new listings down by 1.9 per cent year-over-year to 15,611. We have experienced multiple months this year wherein the annual rate of sales growth outpaced the annual rate of new listings growth, resulting in the overall number of active listings at month-end being well-below last year’s levels. This speaks to tightening market conditions and an accelerating annual rate of price growth.

“Demand for ownership housing increased throughout the spring and summer of 2019 compared to the very slow pace of sales experienced in 2018. That being said, many first-time buyers are still experiencing difficulty finding an affordable home. Federal parties vying for seats in the October election have pledged to alleviate affordability issues hampering first-time buyers with a variety of policy proposals. While these demand-side proposals are important, it is also important that all levels of government remain focused on promoting a sustainable supply of different housing types moving forward,” said Mr. Collins.

The annual rate of price growth in September reached the highest point so far in 2019. The MLS® Home Price Index (HPI) Composite Benchmark was up by 5.2 per cent on a year-over-year basis in September. The average selling price for all home types combined was up by a similar annual rate of 5.8 per cent to $843,115.

On a preliminary seasonally adjusted basis, the September 2019 average selling price was up by 1.2 per cent compared to August 2019.

“It is interesting to note that market conditions for detached homes have tightened over the past year. In many of the regions surrounding the City of Toronto, detached price growth was above the rate of inflation on an annual basis. Consumer polling conducted for TREB over the past few years has pointed out that many intending home buyers are still focused on ground-oriented housing. This points to the need for a greater diversity of housing types to bridge the gap between detached houses and condominium apartments,” said Jason Mercer, TREB’s Chief Market Analyst.

“Statistics Canada’s most recent national population estimate represented the highest twelve month population increase ever recorded. This growth was driven by immigration, of which the GTA was likely a key beneficiary due to its strong regional economy and diversity. As a result, the demand for all types of housing in the GTA – rental and ownership – will remain strong. This fact underpins the need for immediate and sustained action on housing supply,” said TREB CEO John DiMichele.


If you would like to find out what these statistics mean to you, or if you are curious to know how much your property is worth today or how much you can afford to buy, please reach out. 

If you found this article helpful please hit "Like" and "Share".


Comment

2019 August Sales Up, Active Listings Drop

Comment

2019 August Sales Up, Active Listings Drop

Screen Shot 2019-09-06 at 10.41.03 AM.png

7,711 home sales were reported through the Toronto Real Estate Board MLS in August 2019, representing a 13.4 per cent increase over August’s 2018 results.

Detached home sales in the 905 area showed the most significant increase of all property types with a 24.5 per cent rise year-over-year.

The federal government’s First-Time Home Buyer Incentive (FTHBI) that came into effect on September 2 may add further momentum, as the 905 area is anticipated to be a more likely beneficiary of the program than the 416 area.

Total Active Listings continue to be an important part of the story with a drop of available inventory across the board of 11.16 per cent from last year. The 416 area had under 30 per cent of the 15,870 Active Listings reported by TREB for August, indicating that the 905 is heating up faster than the City.

If you would like to find out what these statistics mean to you, or if you are curious to know how much your property is worth today or how much you can afford to buy, please reach out. 

If you found this article helpful please hit "Like" and "Share".

Comment

Summer GTA sales continue to rebound

Comment

Summer GTA sales continue to rebound

JULY 2019 STATS

8,595 home sales were reported through the Toronto Real Estate Board MLS in July 2019, continuing the trend of improved year over year sales with a 24.3 per cent jump from the same month a year earlier. The average selling price for all home types combined was up by just over 3 per cent over the same period and continues to be driven by higher density home types.

On average, single detached home prices remained lower than last year’s levels in the 416 area but had a modest increase of 2.5 per cent in the 905 region.

If you would like to find out what these statistics mean to you, or if you are curious to know how much your property is worth today or how much you can afford to buy, please reach out. 

If you found this article helpful please hit "Like" and "Share".

Comment

June market conditions tighten, renewed price growth in many segments

Comment

June market conditions tighten, renewed price growth in many segments

Screen Shot 2019-07-06 at 1.04.58 PM.png

8,860 home sales were reported through the Toronto Real Estate Board MLS in June 2019, continuing the trend of improved year over year sales with a 10 per cent jump from the same month a year earlier. The average selling price for all home types combined was up by 3 percent over the same period and continues to be driven by a combination of the low inventory of available properties being outpaced by sales.

Bank of Montreal senior economist Robert Kavcic notes that the statistics for June 2019 are “indicative of a market that has all but balanced out – the sales-to-new-listings ratio is close to the 10-year average again.”


If you would like to find out what these statistics mean to you, or if you are curious to know how much your property is worth today or how much you can afford to buy, please reach out. 

If you found this article helpful please hit "Like" and "Share".


Comment

May 2019 sales highest in 17 months

Comment

May 2019 sales highest in 17 months

Screen Shot 2019-06-07 at 10.14.50 AM.png

9,989 home sales were reported through the Toronto Real Estate Board MLS in May 2019, soaring almost 19 per cent from the same month a year earlier. May sales were the highest on a seasonally adjusted basis since December 2017 - up roughly 10 per cent from April which had a 16.8 per cent jump in year-over-year sales.

The average selling price for all home types combined was up by 3.6 percent over the same period. Lack of supply, however, continues to be an ongoing concern as year-over-year growth in new listings at just under 1% was significantly outpaced by sales.

If you would like to find out what these statistics mean to you, or if you are curious to know how much your property is worth today or how much you can afford to buy, please reach out. 

If you found this article helpful please hit "Like" and "Share".

Comment

Substantial year-over-year increase in April sales

Comment

Substantial year-over-year increase in April sales

April Market Report.png

9,042 home sales were reported through the Toronto Real Estate Board MLS in April 2019, a jump of 16.8 per cent compared to April 2018. The average selling price for all home types combined was up by 1.9 per cent over the same period – the strongest annual rate of growth so far in 2019.

Condos continue to trend as a positive driver of year-over-year price growth.

Active listings for the month dropped below levels seen in April 2018 and new listings are not keeping pace with sales - an environment that supports pricing acceleration. This, in combination with the OSFI mortgage stress test, represents a formidable challenge to the first time home buyer, the root of the real estate market. A report issued May 3rd by Canada Mortgage and Housing Corp. citing that there has been “improved alignment overall between house prices and housing market fundamentals” since the stress test was implemented, can be seen as an indicator of the government’s intent to keep the stress test in place for the foreseeable future.

If you would like to find out what these statistics mean to you, or if you are curious to know how much your property is worth today or how much you can afford to buy, please reach out. 

If you found this article helpful please hit "Like" and "Share".

Comment

Competition between buyers, low inventory, keep market tight

Comment

Competition between buyers, low inventory, keep market tight

lubabeley.com march market stats.png

March 2019 activity was the softest in 10 years in the GTA but relative to February, resales increased to just under 2% month-over-month (on a preliminary seasonally-adjusted basis). A lack of buying options continue to be a factor holding back activity as the number of new listings fell 4.5% from a year ago.

Robert Hogue, Senior Economist with RBC, says this explanation finds some support in the fact that the benchmark price rose at a faster pace in March (2.6% year-over-year) than February (2.3%)—suggesting that buyers had to bid more aggressively in the face of limited supply.  While market-cooling government policy continues to dampen consumer confidence, the advent of warmer weather after a particularly harsh winter in the GTA will hopefully bring a welcomed boost to spring market activity.

If you would like to find out what these statistics mean to you, or if you are curious to know how much your property is worth today or how much you can afford to buy, please reach out. 

If you found this article helpful please hit "Like" and "Share".


Comment

Tighter market driving price growth

1 Comment

Tighter market driving price growth

Screen Shot 2019-03-06 at 3.50.05 PM.png

5,025 home sales were reported through the Toronto Real Estate Board MLS in February 2019, down by 2.4 per cent compared to February 2018.

The average selling price for all home types combined was up by 1.6 per cent over the same period.

The semi-detached segment was the best performer, with average prices rising 9.9 per cent on the year and condos continue to trend as a positive driver of year-over-year price growth. A decline of 6.2 per cent for new listings from a year earlier, however, is a concerning statistic that industry analysts suggest is being driven by the OSFI mortgage rules that are keeping buyers on the sidelines.

“The OSFI mandated mortgage stress test has left some buyers on the sidelines who have struggled to qualify for the type of home they want to buy. The stress test should be reviewed and consideration should be given to bringing back 30 year amortizations for federally insured mortgages. There is a federal budget and election on the horizon. It will be interesting to see what policy measures are announced to help with home ownership affordability,” said Mr. Bhaura, President of the Toronto Real Estate Board.

“Home sales reported through TREB’s MLS® System have a substantial impact on the Canadian economy. A study conducted by Altus for TREB found that, on average, each home sale reported through TREB resulted in $68,000 in spin-off expenditures accruing to the economy. With sales substantially lower than the 2016 record peak over the last two years, we have experienced a hit to the economy in the billions of dollars, in the GTA alone. This hit has also translated into lower government revenues and, if sustained, could impact the employment picture as well,” said Jason Mercer, TREB’s Director of Market Analysis and Service Channels.

If you would like to find out what these statistics mean to you, or if you are curious to know how much your property is worth today or how much you can afford to buy, please reach out. 

If you found this article helpful please hit "Like" and "Share".


1 Comment

Moderate year-over-year price increases, record square footage cost for pre-construction condos

Comment

Moderate year-over-year price increases, record square footage cost for pre-construction condos

January 2019 Market Report

4,009 home sales were reported through the Toronto Real Estate Board MLS in January 2019, up by 0.6 per cent compared to January 2018. The average selling price was up by 1.7 per cent for the month year-over-year.

The first month of this year continues to show the condo market segment leading the way in terms of price growth. This segment is one to watch closely, as data released on February 1, 2019 by Urbanation Inc., which tracks data in the pre-construction condo market in the GTA, indicate that prices of pre-build condo units rose 16 per cent in 2018 to a record of $921 a square foot in the GTA over all, and $1,117 a square foot in central Toronto. Over the past two years, new construction condos prices have climbed by 56 per cent in the GTA, far outpacing price increases for resale condos.

Here you can see the real estate market behaviour for the last 5 years 2014 - 2018.

Here you can see the real estate market behaviour for the last 5 years 2014 - 2018.

January 2019 unit sales and inventories look very similar to Jan 2018

January 2019 unit sales and inventories look very similar to Jan 2018

Screen Shot 2019-02-10 at 8.38.23 PM.png
Months of Inventory is currently at 3 months, exactly how it was a year ago. We are still experiencing a seller’s market.

Months of Inventory is currently at 3 months, exactly how it was a year ago. We are still experiencing a seller’s market.

As you can see, Months of Inventory for Detached sector is a bit higher than it is for the Semi-Detached or Condominium properties due to affordability factor.

As you can see, Months of Inventory for Detached sector is a bit higher than it is for the Semi-Detached or Condominium properties due to affordability factor.

Months of Inventory for regions 416 & 905 in all categories.

Months of Inventory for regions 416 & 905 in all categories.

If you would like to find out what these statistics mean to you, or if you are curious to know how much your property is worth today or how much you can afford to buy, please reach out. 

If you found this article helpful please hit "Like" and "Share".


Comment

Mortgage stress test and low inventory influence November 2018 market activity

1 Comment

Mortgage stress test and low inventory influence November 2018 market activity

Screen Shot 2018-12-18 at 5.08.16 PM.png

November 2018 saw a 14.7 per cent drop in sales compared to November of 2017. Lower sales activity for the month year over year was anticipated as the looming imposition of new mortgage stress-test in January 2018 fueled a spike in sales activity at the end of 2017 from buyers wanting avoid the tougher rules. 

With the number of active listings down by 9.8 per cent year over year and a drop of 26.1 per cent in new listings for the period, lack of inventory continues be a key market influencer, pushing home prices up by 3.5%.

Sale prices for semi-detached properties improved the most, although lower-priced housing options such as condos and townhouses continued to show steady increases as influenced by the mortgage stress test restrictions and higher borrowing costs.

If you would like to find out what these statistics mean to you, or if you are curious to know how much your property is worth today or how much you can afford to buy, please reach out. 

If you found this article helpful please hit "Like" and "Share".


1 Comment

GTA Housing Market Conditions Tightened Further in October

1 Comment

GTA Housing Market Conditions Tightened Further in October

Luba+Beley+October+Market+Report.png

The Toronto Real Estate Board released results for October 2018, reporting tightening conditions in the GTA with sales up and new listings down.

Housing sales across the GTA rose last month compared to a year ago. Prices also rose, helped by strong sales in the condo market. The overall average selling price for all housing types in the GTA was $807,340, up 3.5% year over year. Condos were the housing type that experienced the greatest price growth with a 7.5% increase. 

A total of 7,492 sales of all housing types were reported throughout the MLS system in October, which is 6% higher than the same month last year. Condos further drove the October market in unit sales, where 1,519 condo units were sold in the 416 area in October, a result that was greater than the total number of units sold of all other housing types combined in the 416.  It was a very different story in the 905 regions of the GTA where combined sales of 3,771 detached, semi-detached and townhome units in the month outpaced condo units sold by over 6 to 1.


“Annual sales growth has outstripped annual growth in new listings for the last five months, underpinning the fact that listings supply remains an issue in the Greater Toronto Area” noted TREB’s Director of Market Analysis, Jason Mercer, and as seen in the graphic below.

Luba Beley Market Watch Oct 2018

If you would like to find out what these statistics mean to you, or if you are curious to know how much your property is worth today or how much you can afford to buy, please reach out. 

If you found this article helpful please hit "Like" and "Share".


1 Comment

Annual Price Growth Stronger in Higher Density Home Types

Comment

Annual Price Growth Stronger in Higher Density Home Types

The rate of increase in Toronto home prices continues to outpace that of the 905 regions, particularly in the higher density home types.  The price of a detached home in Toronto was roughly 50% higher than in the suburbs on average in September.  Two years ago the price of a detached home in the City was approximately 40% higher than one in the suburbs.  Compare that with condo prices in the City, which two years ago were about 20% more expensive than in the suburbs, but in September, 2018 are now almost 35% more expensive, as seen in the chart below.  The average price of the 6,455 homes sold in the GTA in September was $796,786, 2.9% higher than the average of $774,489 a year earlier when 6,334 units were sold in the GTA.

Screen Shot 2018-10-05 at 8.59.42 AM.png

The more affordable home types including condominiums, townhouses and semi-detached homes all saw strong price growth in September, compared to the prior year.  In contrast, the average price of a detached home in the GTA was relatively flat compared to 2017.  The average price of a detached home in the City of Toronto, where approximately 23% of total GTA detached home sales occurred, was down by 1.4%, compared to the suburbs, where the average price was 0.6% less than a year earlier.  The average selling price for a detached home in Toronto in September was $1,342,363, compared to the average suburban selling price of $905,722.

Screen Shot 2018-10-05 at 9.02.30 AM.png

In the City of Toronto, where slightly more than 70% of total GTA condominium sales occurred in September, the Toronto Real Estate Board (TREB) reported 1,282 condominium unit sales. The average price of a condominium in Toronto rose by 11.7% in September year-over-year, almost twice the rate of increase in the price of the average condominium in the 905 regions, where prices rose by 6.4%. The average selling price for condominium in Toronto in September was $615,582, compared to the average suburban selling price of $455,686.

Screen Shot 2018-10-05 at 9.03.52 AM.png

This final chart shows how Toronto has continued to dominate the share of the total GTA condominium sales in September for the past three years.  Now more millennials and Gen Z (those born between the early 1980s and early 2000s) are entering the housing market.  For them, a condo lifestyle is both preferred and affordable.  Condos also remain in high demand among retiring boomers, particularly those who are downsizing and wish to remain in an urban setting in a large metropolitan City such as Toronto.

Screen Shot 2018-10-05 at 9.05.05 AM.png

If you would like to find out what these statistics mean to you, or if you are curious to know how much your property is worth today or how much you can afford to buy, please reach out. 

If you found this article helpful please hit "Like" and "Share".


Comment

GTA Housing Sales and Price Growth Continues in August

Comment

GTA Housing Sales and Price Growth Continues in August

Greater Toronto Area housing sales of 6,939 units increased by 8.5% in August, 2018, compared to August, 2017 when 6,306 unit sales were recorded.  The average price of a home in the GTA also rose by 4.7% year over year and now stands at $765,270, compared to $730,969 in August 2017.  Month-over-month sales and price growth also continued in August and the annual rate of sales growth outpaced the annual rate of new listings growth.

Detached home sales were up by over 16% on a year-over-year basis in August, substantially more than the 1.6% increase in the other less-expensive semi-detached, townhome and condominium segments of the market.

Screen Shot 2018-09-09 at 11.17.56 AM.png

The 905 Regions surrounding the City fuelled most of this growth in detached unit sales, particularly in the Peel and York Regions, which recorded increases in detached unit sales of 32.6%, and 25.7%, respectively, as seen in the chart below.  In the City of Toronto (416) detached unit sales increased by 10.3%.

Screen Shot 2018-09-09 at 11.18.46 AM.png

Conversely, the City of Toronto is where average sales prices increased the most, at 8.1% year-over-year.  Prices also rose by 7.6% in Peel Region, while other areas of the GTA mostly experienced a percentage decrease in average selling prices.

There is now only slightly more than  2 ½ months inventory in the GTA as a whole and less than 2 months of inventory in the City of Toronto.  Many GTA neighbourhoods continue to suffer from a lack of inventory, although this is more pronounced in the City of Toronto.  York Region (north of the City) continues to have the largest supply of homes available for sale at 4.3 months supply, while in Halton, Peel and Durham (the regions northwest, west and east of the City, respectively), inventories are only slightly higher than in the City, at 2.3 to 2.4 months supply.

Screen Shot 2018-09-09 at 11.21.15 AM.png

Ownership of a home remains a solid long-term investment in the GTA, a region where the economy remains strong and the population continues to grow.

If you would like to find out what these statistics mean to you, or if you are curious to know how much your property is worth today or how much you can afford to buy, please reach out. 

If you found this article helpful please hit "Like" and "Share".


Comment